FIGURE 2.

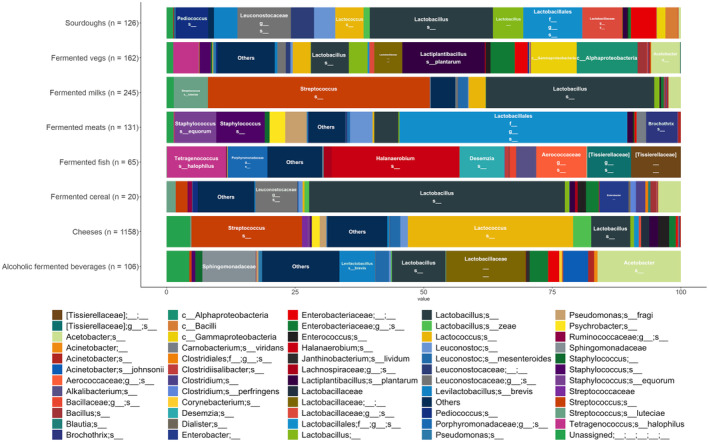
Bar plot showing, for each fermented food category, the average relative abundance of the taxa occurring in >25% of the group samples with an abundance >0.5%. All taxa with abundance <0.5% were included in “Others.”

Bar plot showing, for each fermented food category, the average relative abundance of the taxa occurring in >25% of the group samples with an abundance >0.5%. All taxa with abundance <0.5% were included in “Others.”