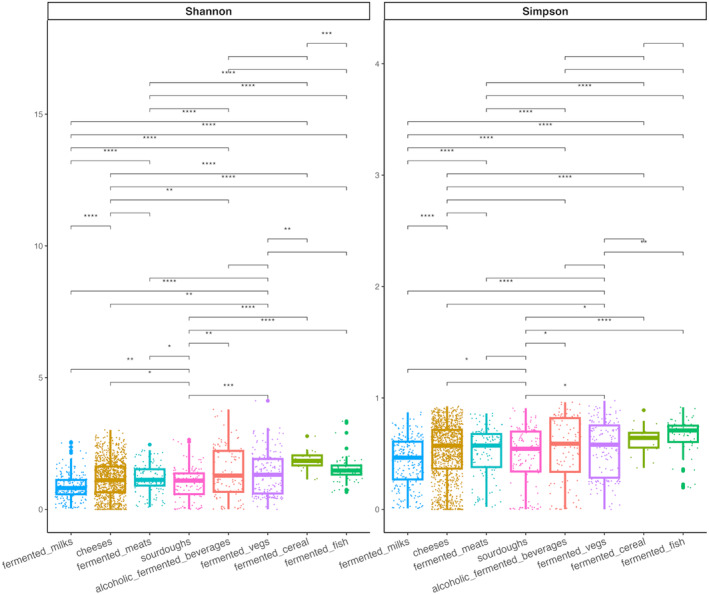
FIGURE 3.

Box plot showing the Shannon's and Simpson's alpha diversity indices in each fermented food group. The means of the indices are compared across the groups using paired Wilcoxon's rank‐sum test. *p < 0.05; **p < 0.01; ***p < 0.001; ****p < 0.0001.
