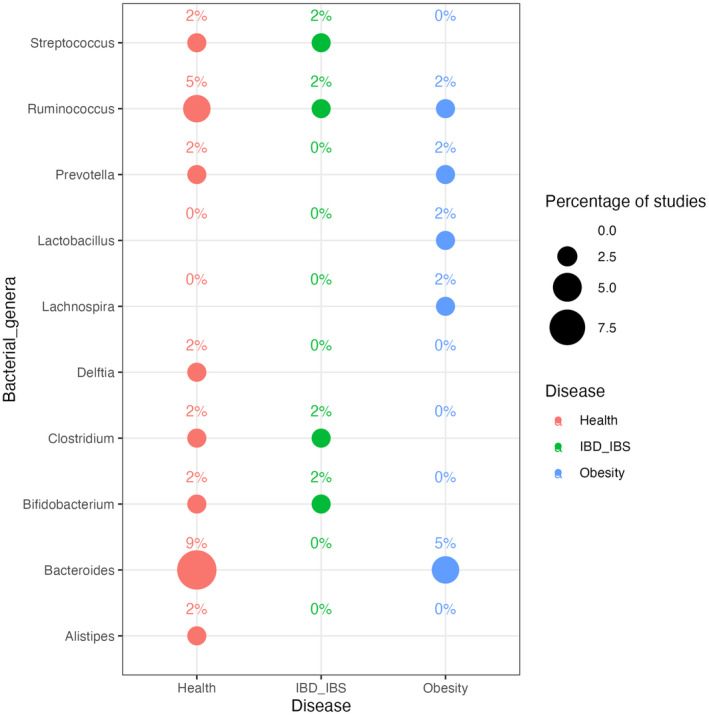
FIGURE 4.

Bubble plot showing the percentage of studies (from those summarised in Table 3) in which microbial genera increase after an intervention with different FFs. Bubble size is proportional to the number of different studies reporting the same association. The group labelled as “Health” corresponds to those intervention studies where the population was described as “Healthy.” The total number of intervention studies reported in this analysis is 44.
