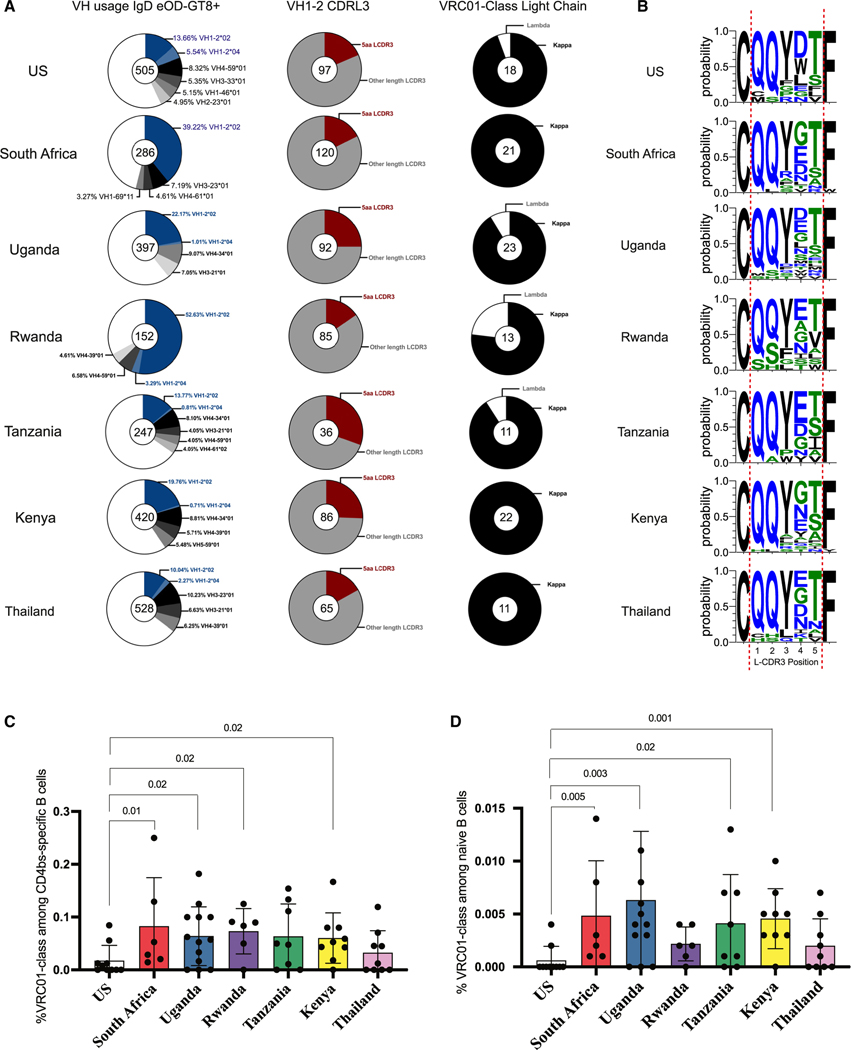
Figure 2. Increased VRC01-class gene signature among African cohort.
(A) Pie chart of VH use among eOD-GT8+ naive B cells from different cohorts; blue slices indicate the VH1–2 gene, and gray shades indicate the other most frequent VH genes (left panel). VH1–2+ sequences paired with a 5 aa L-CDR3 (red, middle panel) and VRC01-class naive B cells expressing kappa (κ) or lambda (λ) LCs among total VRC01-class naive B cells. Total B cell sequences are indicated at the center of each pie chart.
(B) Weblogo comparing L-CDR3 sequences of VRC01-class naive B cells from all different cohorts.
(C) Frequency of VRC01-class signatures among eOD-GT8+ naive B cells for each cohort.
(D) Frequency of VRC01-class signatures among total IgD+ naive B cells for each cohort. Statistical significance was determined using the two-tailed Mann-Whitney test.

