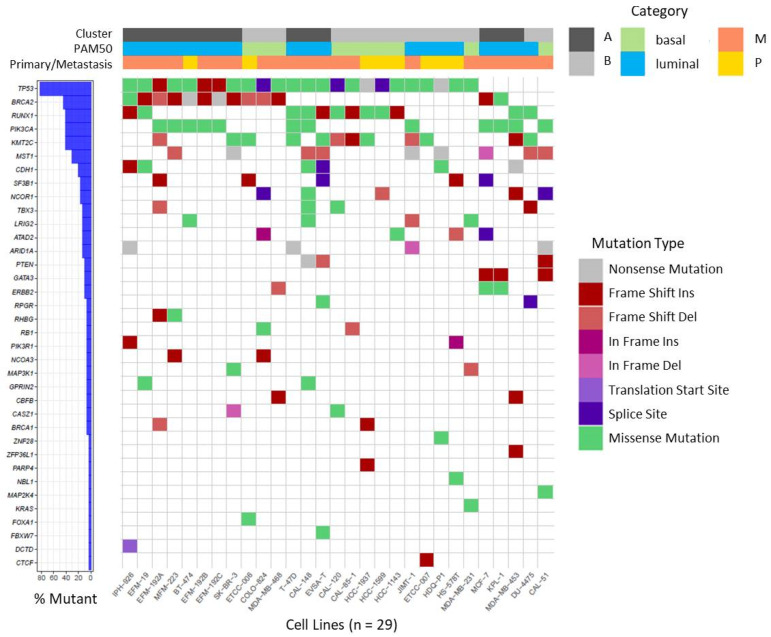
Figure 3.
Waterfall plot depicting recurrent non-synonymous mutations in BC cell lines. Mutations were called on RNA-seq data for the gene set reported by Ciriello et al. [54], in BRCA1 and BRCA2 and visualized as waterfall plot for the 36 genes in which mutations were identified. For details of identified mutations see Table S2. Assignments of BC cell lines to specific categories (Cluster, PAM50, origin from primary or metastatic tumor) are depicted on top by color codes.

