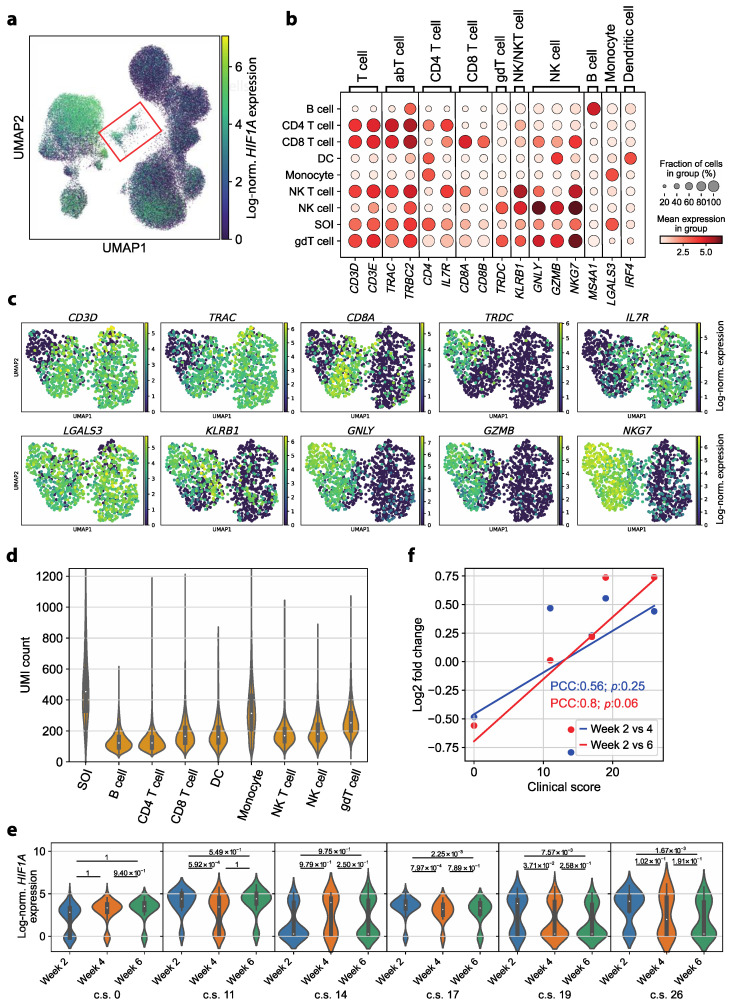
Figure 4.
Circulating complexes formed by monocytes with either T cells or NK cells represent a persisting dysregulation in convalescent COVID-19 patients. (a) Log-normalized HIF1A expression per cell colored in the UMAP representation of all cells (all cell types, all patients, all time points). The subcluster of interest (SOI) is marked by a red box. (b) Mean log-normalized expression of marker genes in each cell type and the subcluster of interest (SOI). (c) Log-normalized expression of selected marker genes in the UMAP representation of the SOI after calculating a neighbor graph. (d) UMI count per cell in each cell type and the SOI. The SOI depicts significantly higher UMI counts than the monocytes (p value of Wilcoxon rank sum test with the alternative hypothesis that the UMI counts in the SOI are greater: 4.36 × 10−123). (e) Log-normalized HIF1A expression in the cells in the subcluster of interest for each patient, represented by the respective clinical score (c.s., range 0–45), ordered by time point. A Wilcoxon rank sum test with the alternative hypothesis that the expression at the respective earlier time point is greater than the expression at the later time point was performed for each pair of time points. (f) Log2-fold change (y-axis) of the mean log-normalized HIF1A expression in the SOI in week 2 compared to week 4 (blue) and week 6 (red) depending on the c.s. of the patient (x-axis). The trend of the data points is indicated by a linear regression (line). The strength of correlation is described by the Pearson’s correlation coefficient (PCC) and p value (p).

