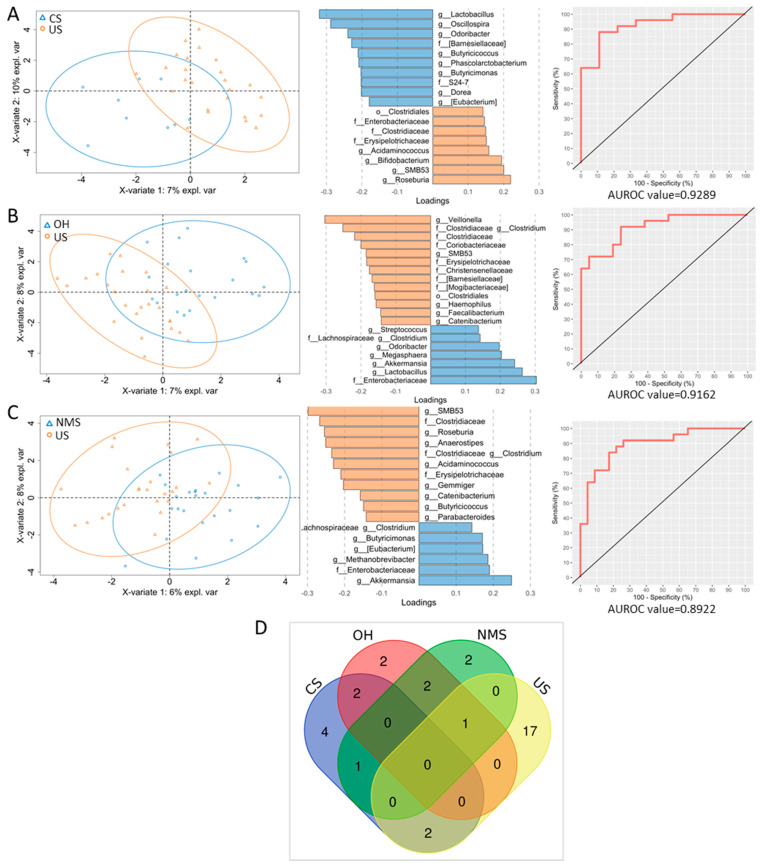
Figure 4.
PLS-DA and loading plots show the differences in microbial taxon abundance comparing US versus CS (A), US versus OH (B), and US versus NMS (C). For each PLS-DA, the ROC curve with the AUROC value is reported. Venn diagram of the PLS-DA-filtered ASVs that are shared or unique amongst the TLC groups (D) (created by https://bioinformatics.psb.ugent.be/webtools/Venn/, (accessed on 13 December 2023)).

