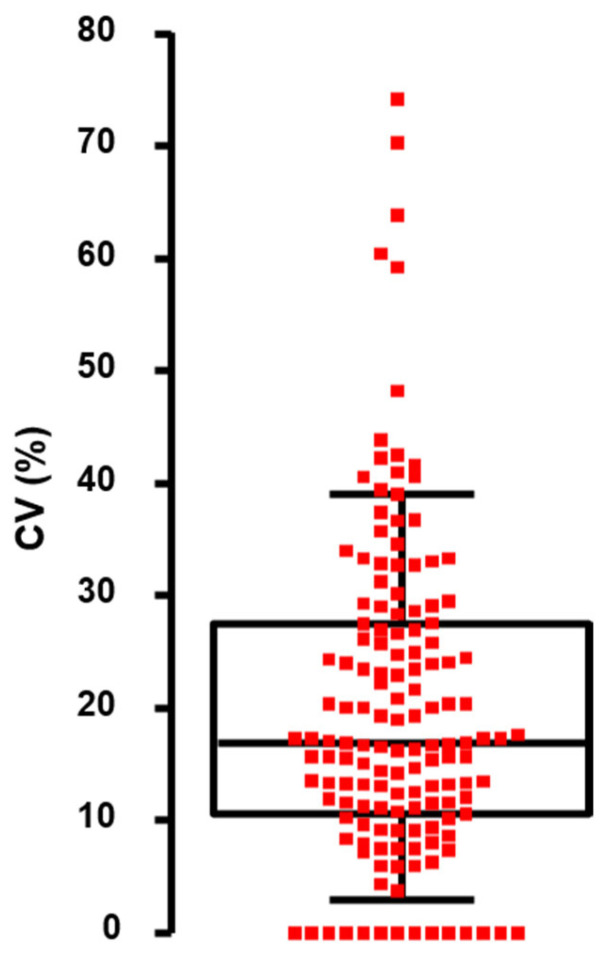
Figure 4.
Distribution of the coefficient of variation (CV) of the phage titers obtained from 147 positive interactions. Each dot is the CV of one titration performed in triplicate. A CV of 0 means that no variation was observed within the triplicate (equal number of PFUs on each replicate). The box plot indicates median and interquartile ranges (25–75%); whiskers represent the 10th and 90th percentiles.

