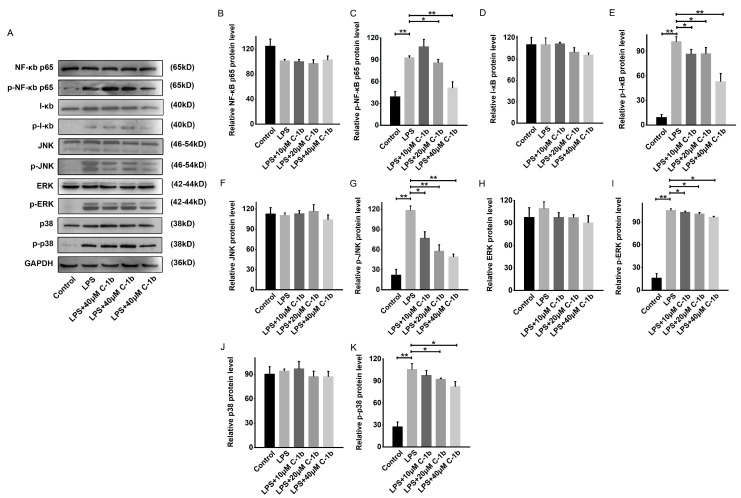
Figure 3.
Chensinin-1b suppressed the NF-κB and MAPK pathways in LPS-stimulated RAW 264.7 cells (A–K). Cells were subjected to treatment with chensinin-1b (0, 10, 20, or 40 μM) with the presence of 1 μg/mL LPS for 24 h. Western Blot analysis was performed to assess the protein expression of NF-κB p65, phospho-NF-κB p65, I-κB, phospho-I-κB, JNK, phospho-JNK, ERK, phospho-ERK, p38, and phospho-p38. Data represent the mean ± SEM (n = 3), with * p < 0.05 and ** p < 0.01.

