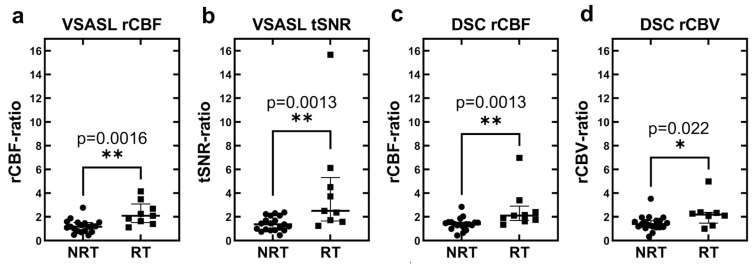
Figure 2.
Dot–whisker plots of relative perfusion values of patients without and with tumor recurrence measured by (a) VSASL rCBF, (b) VSASL tSNR, (c) DSC-PWI rCBF, and (d) DSC-PWI lc-rCBV. In each plot, all points are included and represented in round or square dots from no recurrent tumor (NRT) and recurrent tumor (RT) groups, respectively. The middle bar represents the group median; the upper and lower bars represent the interquartile range. For all four perfusion parameters, there is significantly higher median values in RT compared to NRT cases. ** denotes significant level p < 0.005 and * denotes p < 0.05.

