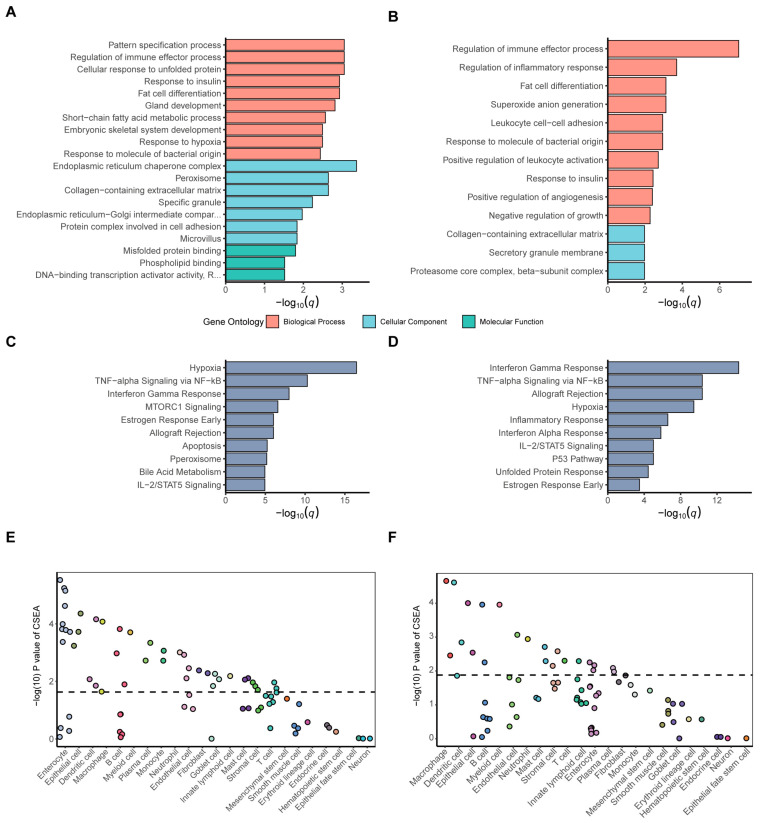
Figure 3.
Functional enrichments for IBD signatures around GR and TET2. Top slimmed GO terms for the (A) GR- and TET2-related UC DEGs and (B) GR- and TET2-related CD DEGs upon the threshold of q < 0.05. Top MSigDB hallmark-pathway enrichments for the (C) GR- and TET2-related UC DEGs and (D) GR- and TET2-related CD DEGs upon the threshold of q < 0.05. CSEA testing results of the (E) GR- and TET2-related UC DEGs and (F) GR- and TET2-related CD DEGs. The x-axis indicates the cell types derived from the intestinal tissue and blood. Dots represent the intestine cell types annotated by 23 general classifications descending by order of significance. The dashed line is the significant threshold with FDR < 0.05.

