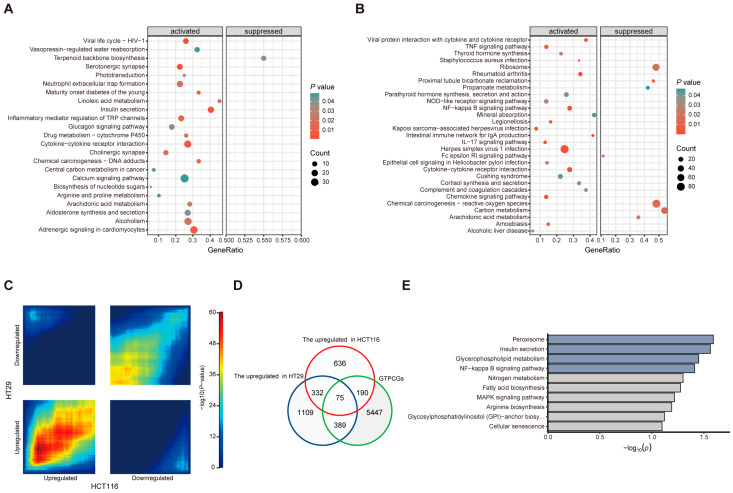
Figure 4.
Comparative transcriptome analyses of two in vitro inflammatory cell models. GSEA revealing the overrepresented pathways in overall gene expression of (A) HCT116 cells and (B) HT29 cells after LPS stimulation. (C) RRHO analysis results for comparing expression patterns across the two cell models. (D) Venn diagram showing the overlapping genes between specific three gene sets. (E) KEGG pathway enrichments for the overlapping genes.

