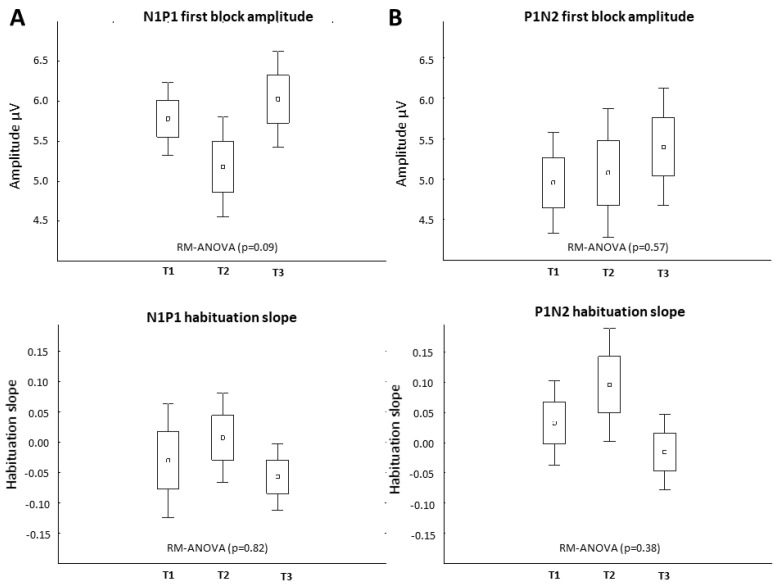
Figure 3.
Effect of rTMS-QPI on VEP in CM-MOH patients—group level (n = 12). T1: baseline before stimulation, T2: immediately after, and T3: 3 h after one session of occipital rTMS-QPI. Panel (A): N1P1 VEP component: 1st block amplitude (above) and habituation slope (below). Panel (B): P1N2 component: 1st block amplitude (above) and habituation slope (below) (means ± SEM).

