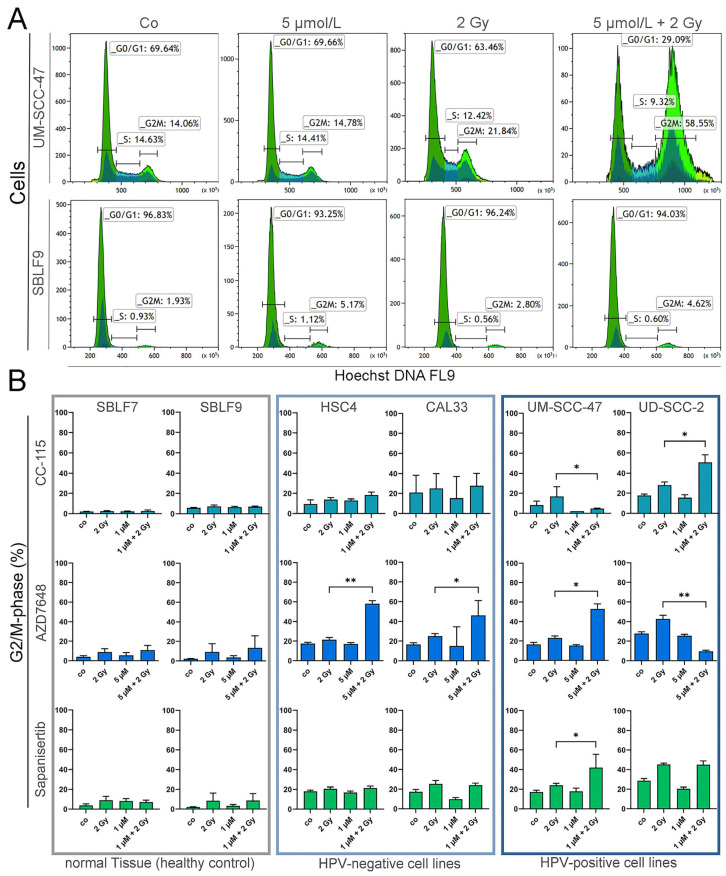
Figure 4.
Cell cycle analysis of HNSCC and healthy tissue cells. (A) Representative histograms and gating strategy after treatment with 5 µmol/L AZD7648 (DNA-PK-I), IR with 2 Gy, and IR + KI treatment in UM-SCC-47 (HNSCC) and SBLF9 (fibroblast) cells. (B) Cells counted in G2/M phase after treatment with CC-115 (mTOR/DNA-PK-I), AZD7648 (DNA-PK-I), or Sapanisertib (mTOR-I); 2 Gy IR; or IR + KI. Cells are grouped into normal tissue cells (SBLF7, SBLF9) and HPV− (CAL33, HSC4) or HPV+ (UM-SCC-47, UD-SCC-2) HNSCC cell lines. Each value represents mean ± SD (n ≥ 3). Significance was estimated by a one-tailed Mann–Whitney U test for mTOR-I-treated cells (CC-115 or Sapanisertib) and a two-tailed Mann–Whitney U test for DNA-PK-I as monotherapy (AZD7648), * p ≤ 0.05 and ** p ≤ 0.01. p = 0.004: HSC4 + AZD7648, UD-SCC-2 + AZD7648; p = 0.0143 UM-SCC-47 + AZD7648; p = 0.0238: UM-SCC-47 + CC-115; p = 0.0286: UD-SCC-2 + CC-115, UM-SCC-47 + Sapanisertib; p = 0.0325: CAL33 + AZD7648.

