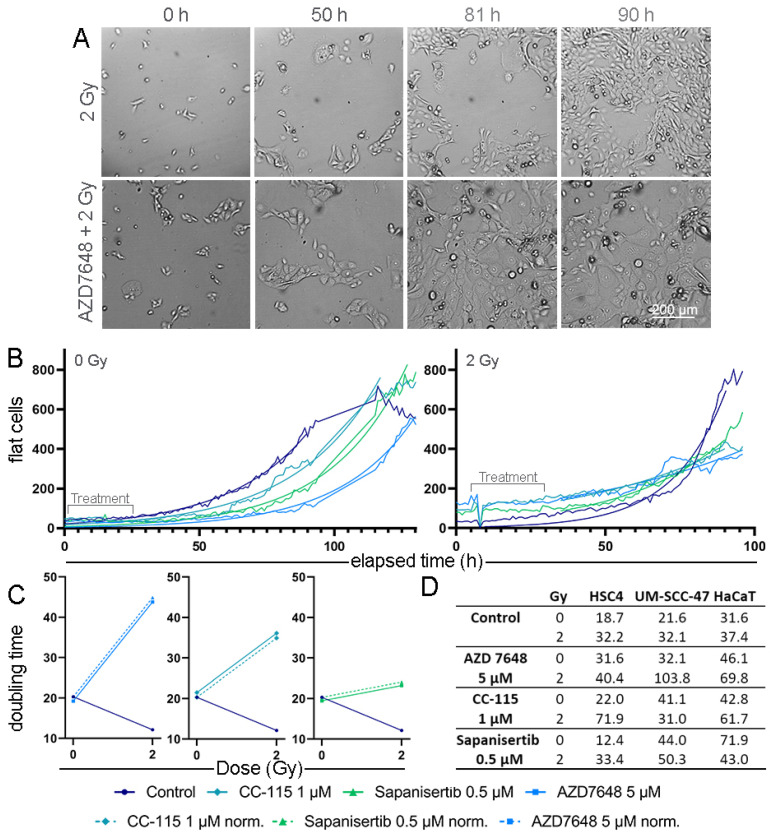
Figure 5.
Real-time cell proliferation of HNSCC and normal cells under treatment. (A) Exemplary images of HNSCC CAL33 cells under IR ± 5 µM AZD7648 treatment starting from seeding to overgrowth of the surface. (B) Growth curve of normal-shaped CAL33 cells after IR ± KI treatment. An exponential growth equation was fitted from the data points. (C) Doubling time of CAL33 cells in hours under KI ± IR treatment, based on the exponential growth equation above. (D) Doubling time of HSC4, UM-SCC-47 (HNSCC), and HaCaT (healthy keratinocyte) cells in hours.

