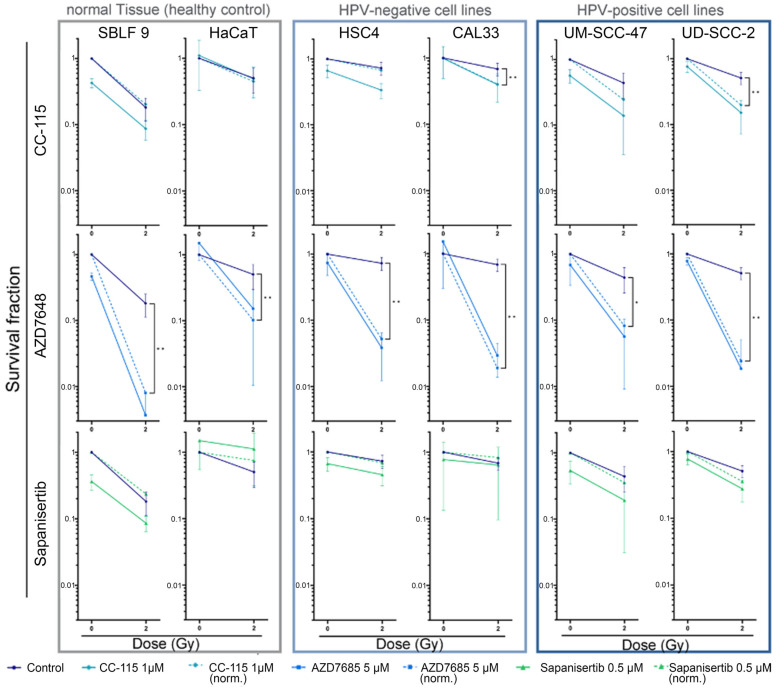
Figure 6.
Colony-forming assay of HNSCC cell lines and normal controls. Cells are shown grouped into normal cells (SBLF9, HaCaT) and HPV− (CAL33, HSC4) and HPV+ (UM SCC 47, UD SCC 2) HNSCC cells. Graphs show cell survival at 0 Gy and 2 Gy, either with additional treatment by KIs (1 µmol/L CC115, 5 µmol/L AZD7648, 0.5 µmol/L Sapanisertib) or without. Additionally, cell survival under KI treatment was normalized to detect synergistic effects. Dashed lines represent mean survival fraction normalized to the cytotoxicity induced by KI alone. Each value represents mean ± SD (n ≥ 3). Significance was estimated by a one-tailed Mann–Whitney U test, * p ≤ 0.05 and ** p ≤ 0.01. p = 0.001: UD-SCC 47 + CC-115 norm., SBLF9 + AZD7648 norm.; p = 0.009: HaCaT + AZD7648 norm., CAL33 + AZD7648 norm., HSC4 + Sapanisertib norm.; p = 0.018: CAL33 + CC115 norm.; p = 0.036: HSC4 + CC-115 norm.; p = 0.042: UM-SCC 47 + AZD7648 norm.

