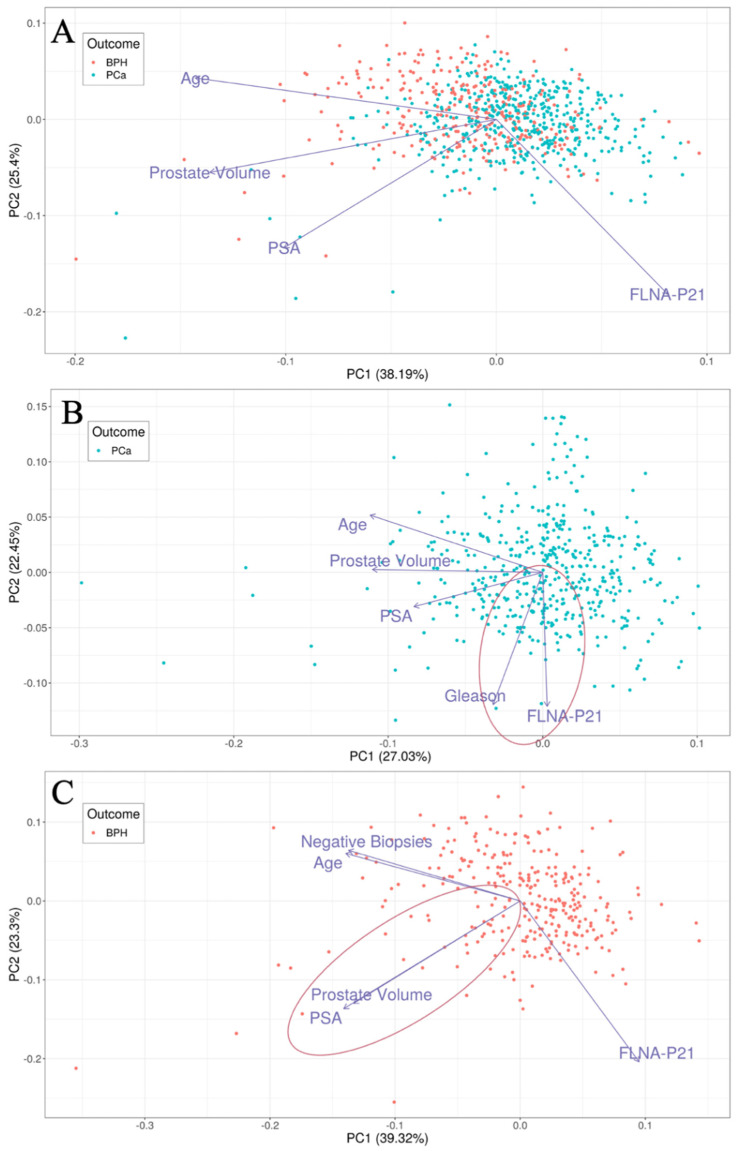
Figure 1.
Principal component analysis plots showing first two principal components (PCs) for (A) patients with PCa and BPH (n = 777), (B) patients with PCa (n = 477), (C) patients with BPH (n = 300). In each plot, loadings of feature used for PCA are represented as vectors. Angles between any two loadings signify the correlation between the features (smaller angles = positive correlation; right angles = no correlation; wide angles = negative correlation). Highlighted in red are two correlations of importance; FLNA is positively correlated with Gleason in patients with PCa (panel B) and PSA is strongly positively correlated with prostate volume in patients with BPH (panel C).

