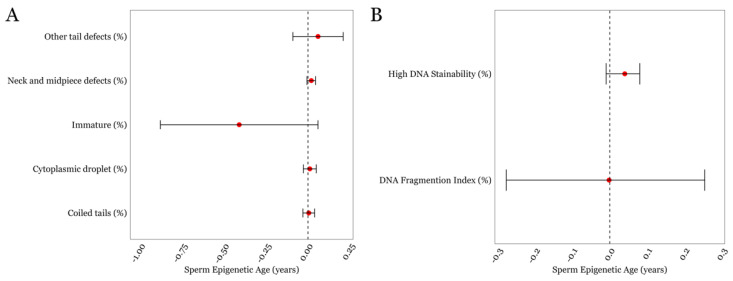
Figure 3.
The associations between SEA and various other sperm characteristics in the LIFE cohort. (A) Sperm parameters describing regions below the head (B) DNA damage-associated parameters. Error bars in the plots represent 95% confidence intervals for the coefficient estimates. Red dots and dotted lines represent the effect estimates for each analysis and the line of null effect, respectively.

