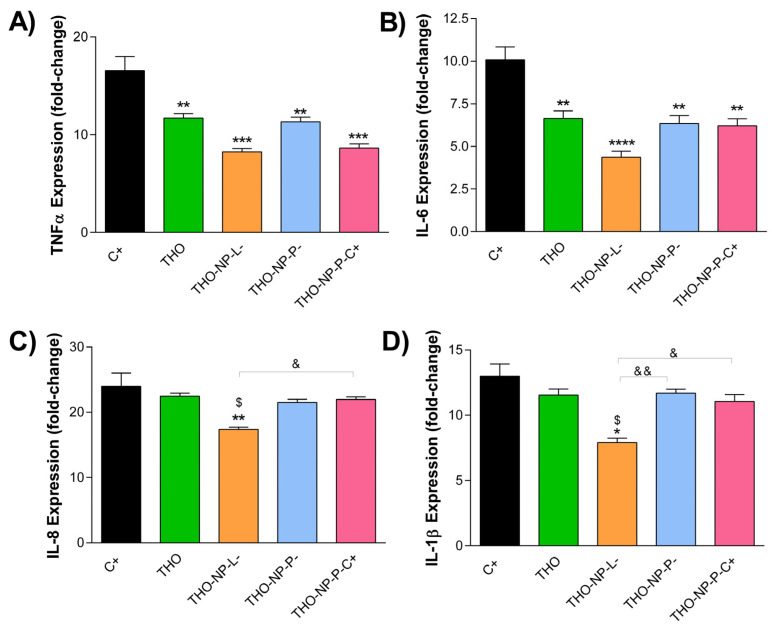
Figure 2.
Gene expression values of inflammatory cytokines in HaCaT cells infected with C. acnes and treated with THO or THO-NPs. Relative mRNA levels of (A) TNF-α, (B) IL-6, (C) IL-8, and (D) IL-1β, measured by RT-qPCR, with β-actin as the endogenous control. Values (Mean ± SEM, n = 3) are expressed as fold-change compared to untreated HaCaT cells (control+). Statistical analysis was performed by one-way ANOVA, followed by Tukey’s Multiple Comparison Test, and is represented as: * p < 0.05, ** p < 0.01, *** p < 0.001 or **** p < 0.0001: versus positive control (C+), $ p < 0.05: versus THO, and & p < 0.05 or && p < 0.01: versus other THO-NPs.

