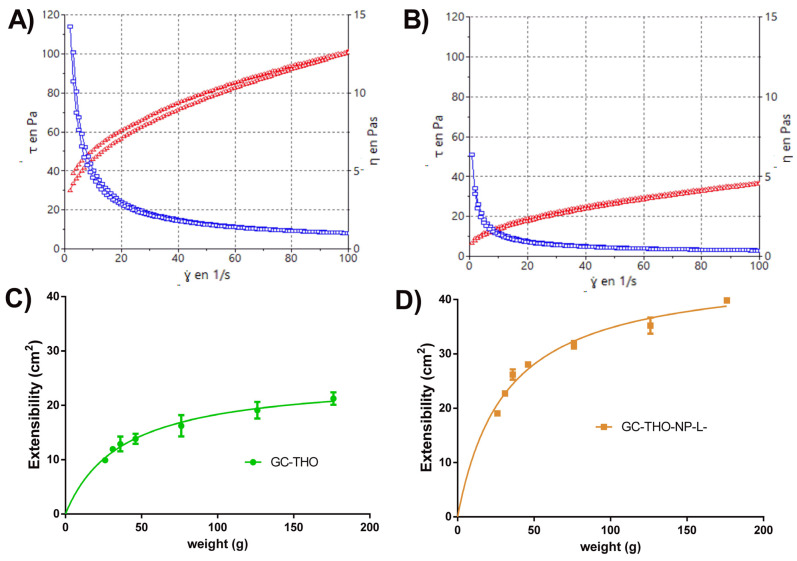
Figure 5.
The characterization of the developed hydrogels, GC-THO and GC-THO-NP-L- (left and right, respectively). (A,B) Rheological profile with viscosity curve (blue line) and flow curve (red line) (τ: shear stress, ץ: shear rate, η: apparent viscosity). (C,D) Extensibility profile as the function of increasing weights, adjusted to the Hyperbola equation.

