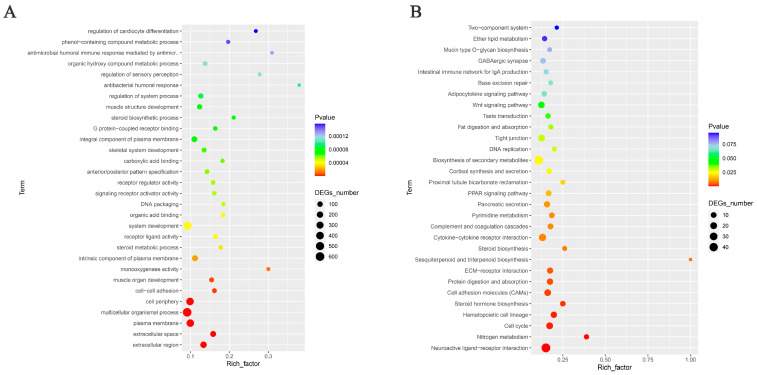
Figure 2.
Functional annotations of differentially expressed genes in HEP and LEP groups. (A) Histogram of differential gene GO enrichment. The horizontal coordinate is the number of genes, and the vertical coordinate is the enrichment of genes in GO. (B) Scatter plot of KEGG enrichment for differentially expressed genes. The top 30 enrichment classifications of the KEGG pathway of the DEGs are listed in the figure. The horizontal axis indicates the enrichment factor, and the vertical axis indicates the name of the pathway. The point size indicates the number of enriched DEGs in the pathway, and the point color corresponds to a different range of p-values.

