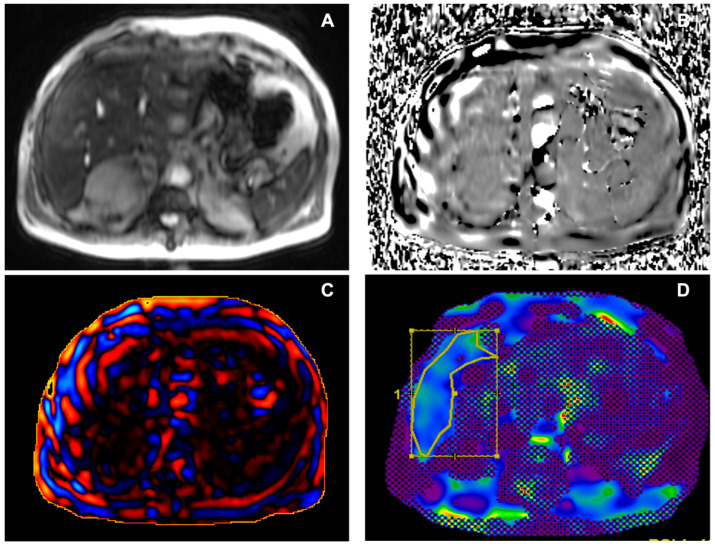
Figure 3.
Male, 69 years old, with multiple metabolic risk factors and l grade hepatic fibrosis (2.9 kPa). (A) Axial magnitude image showing the signal void in the anterior abdominal subcutaneous tissues. (B) Phase image showing waves propagating through liver tissue. (C) Wave image showing wave propagation, with thin waves moving parallel to the liver surface. (D) Corresponding colour elastogram, with free-hand ROI placed in the liver tissue not covered by the 95% confidence map; the colour blue is generally found in non-fibrotic or low-grade fibrosis stiffness values. kPa: kilopascals; ROI: region of interest.

