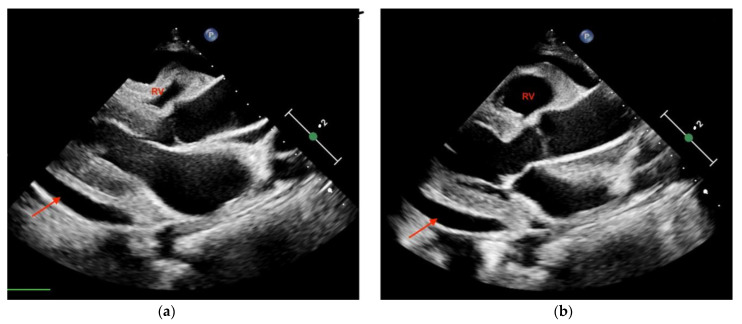
Figure 2.
Transthoracic echocardiography (PSLA view) showing the anechoic separation of the pericardial layers measuring 1.4 cm in diastole (arrow). (a) Right ventricle (RV) systolic collapse is shown on the left image; (b) right ventricular outflow tract diastolic collapse can be seen on the right image.

