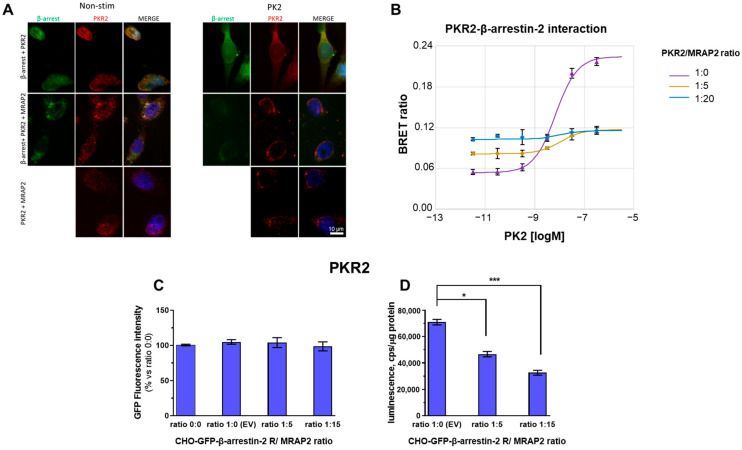
Figure 1.
β-arrestin-2 recruitment to PKR2 in the presence of MRAP2. (A) Representative immunofluorescence images of CHO cells transfected with GFP-β-arrestin-2 (green) and PKR2 (red), in the absence or in the presence of MRAP2 and in the absence of PK2 (−) or in the presence of PK2 100 nM (+) for 1 h. Scale bar 10 μm. The cell nuclei were counterstained with DAPI (blue). (B) Concentration–response curves of PK2 after transient transfection of PKR2-rLuc recorded by BRET assay in CHO cells stably co-expressing GFP-β-arrestin-2 and transiently transfected with PKR2-rLuc and with increasing amounts of MRAP2 vectors (PKR2-rLuc /MRAP2 ratio: 1:0, 1:5, or 1:20). (C) GFP β-arrestin-2 levels were analysed on cell monolayers of transfected cells expressing rGFP-β-arrestin-2 after transient transfection with equal amounts of the luminescent receptor and increasing amounts of vectors expressing MRAP2. (D) The levels of luminescent receptor PKR2/rLuc was measured on total protein preparations (cps/μg proteins) of cells expressing rGFP-β-arrestin-2 after transient transfection with equal amounts of either luminescent receptor or increasing amounts of vectors expressing MRAP2 using a plate luminometer. The bar graph represents the mean ± SEM of the triplicate determination of cps values obtained in each individual experimental condition (receptor/MRAP2 cDNA ratio: 1:0; 1:5; 1:15). Data (symbols) representing the means ± SEM of three independent determinations in the contest of one over two independent experiments performed, giving overlapping results (means of triplicates), are shown with the best-fitting theoretical curves. A student’s t-test was used for statistical analysis; * p < 0.05, *** p < 0.001.

