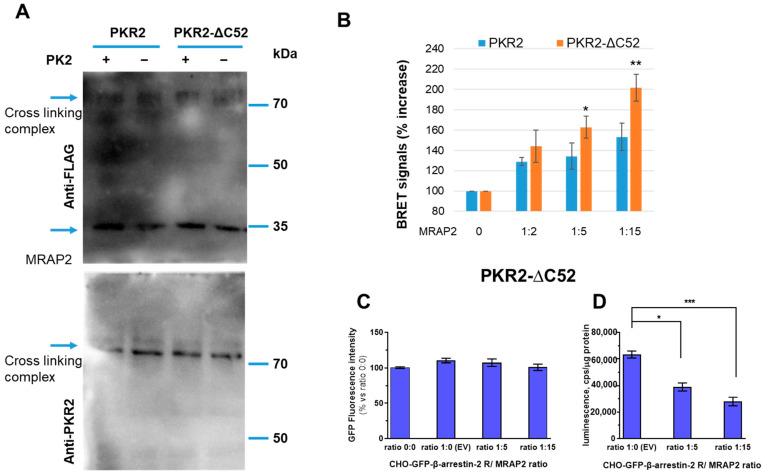
Figure 3.
The C-terminal region of PKR2 in the modulation of β-arrestin-2 recruitment by MRAP2. (A) Cross-linking of MRAP2 with PKR2 or the PKR2-ΔC52 receptor mutant. CHO cells expressing WT PKR2 or the PKR2-ΔC52 mutant were incubated with dithiobis (succinimidyl propionate). Proteins were immunoblotted and probed with anti-PKR2 antibodies. (B) Bar graphs of PKR2-rLuc and PKR2-ΔC52 mutant-rLuc recorded by BRET assay in CHO cells stably co-expressing GFP-β-arrestin-2 in the absence or presence of MRAP2. PKR2 and PKR2-ΔC52-βarrestin-2 interaction in the presence of increasing concentrations of MRAP2 (1:2, 1:5, and 1:15 receptor/MRAP2 ratio), measured in the absence of PK2. A Students’ t-test was used for statistical analysis; * p < 0.05, ** p < 0.01 versus basal. (C) GFP β-arrestin-2 levels were analysed on cell monolayers of transfected cells expressing rGFP-β-arrestin-2 after transient transfection with equal amounts of the luminescent PKR2-ΔC52 receptor and increasing amounts of vectors expressing MRAP2. (D) The levels of luminescent receptor PKR2-ΔC52/rLuc were measured on total protein preparations (cps/μg proteins) of cells expressing rGFP-β-arrestin-2 after transient transfection with equal amounts of either luminescent receptor or increasing amounts of vectors expressing MRAP2 using a plate luminometer. The bar graph represents the mean± SEM of the triplicate determination of cps values obtained in each individual experimental condition (receptor/MRAP2 cDNA ratio: 1:0; 1:5; 1:15). Data are expressed as the percentage of the signal increase in the presence of MRAP2 compared to the empty vector. Data are the means ± SEM from three independent experiments, each performed in triplicate. One-way ANOVA was used for statistical analysis followed by a Dunnett’s test for multiple comparisons * p < 0.05, *** p < 0.001 vs. PKR2-ΔC52 MRAP 0.

