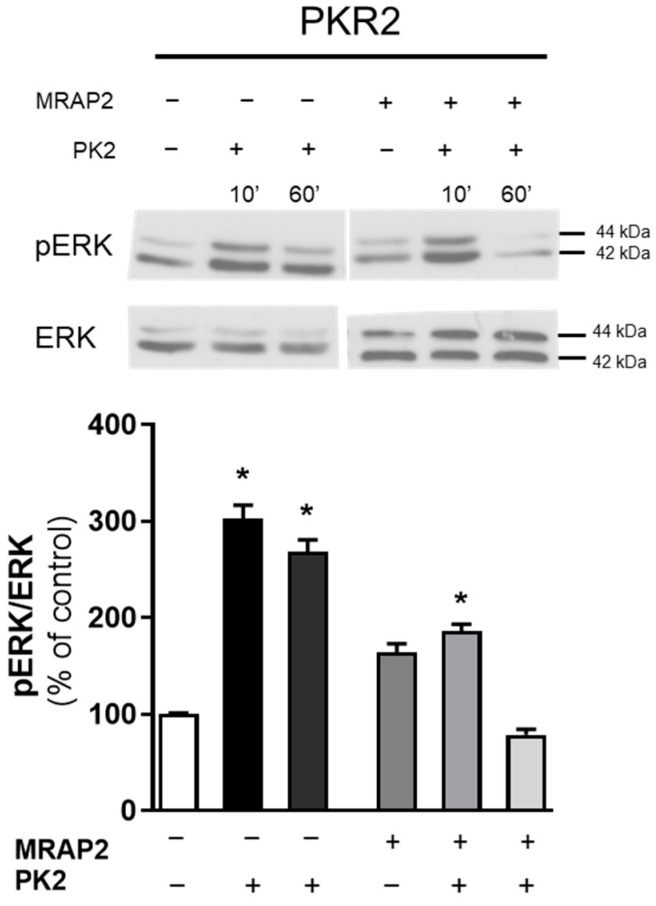
Figure 4.
Analysis of ERK1/2 phosphorylation in CHO cells transfected with WT PKR2. The densitometric plots show the pERK1/2 and ERK1/2 protein levels at 10 and 60 min after treatment with PK2 100 nM. The bar graphs show the ratio of pERK1/2/ERK1/2 and the percentage increase compared to unstimulated cells (control). The bars show the mean values ± SEM from the three experimental conditions. A two-way ANOVA followed by Sidak’s multiple comparisons test was used for statistical analysis * p < 0.05 versus control.

