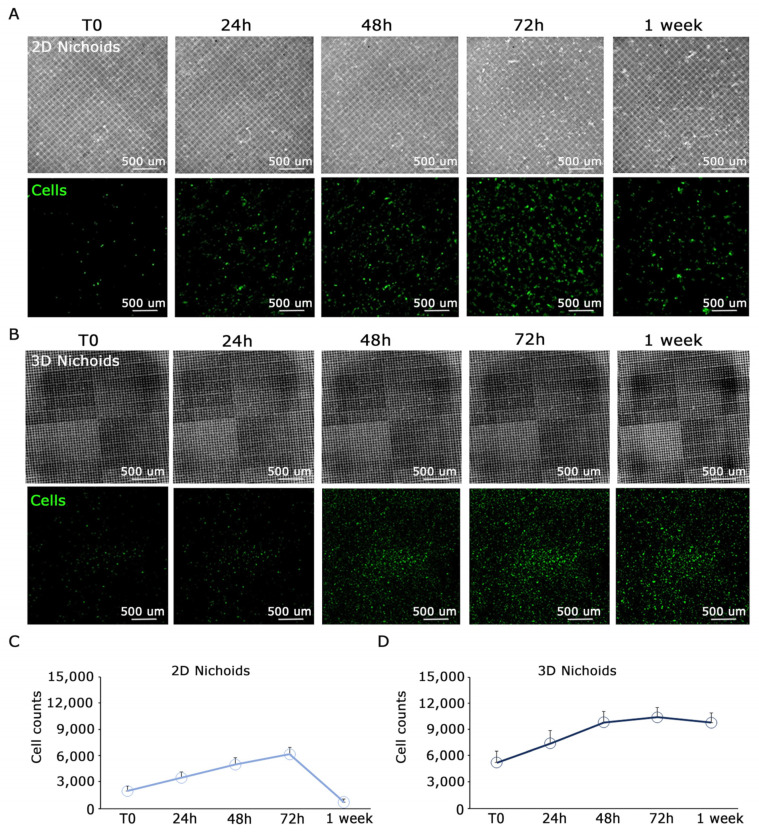
Figure 3.
Proliferation analysis of cells in 3D and 2D Nichoid shows a decrease in proliferation at day 3 in 2D condition. (A). Top: images of the 2D Nichoid captured in widefield mode at different time points; bottom: images of representative MPM primary cells detached from the Nichoid structure at different time points. (B). Top: images of the 3D Nichoid captured in widefield mode at different time points; bottom: images of representative MPM primary cells detached from the Nichoid structure at different time points. In the cells channel, the contrast was increased to emphasize the signal/noise ratio. (C,D). Plot of cell counts performed on the entire well in 2D Nichoid (C) and 3D Nichoid (D). After day 3, a considerable decrease in proliferation is observed in the one-floor control, while, in the 3D condition, a plateau is reached. Scale bars are displayed.

