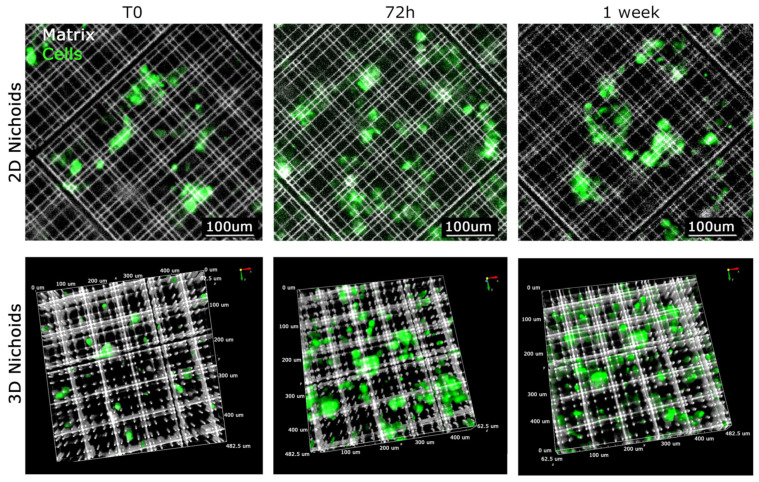
Figure 4.
Growth of cells in XYZ dimension in 2D and 3D Nichoid. Visualization of representative primary MPM cells grown in 2D Nichoid (top) and 3D Nichoid (bottom) at defined time points. The 2D structure is represented by only 1 plan and 3D structure by Z-stack spanning 30 um in thickness. MPM cells stained with CFSE are visualized in green, whereas the Nichoid grids, fluorescence emitting upon violet light excitation (385 nm), are displayed in white. Scale bars and 3D orientation as displayed.

