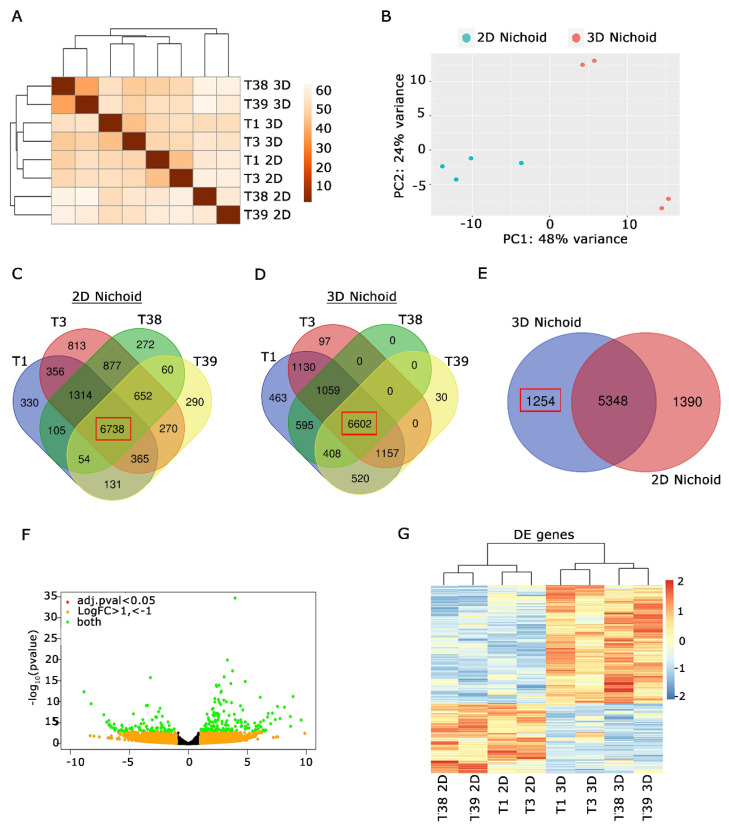
Figure 5.
Transcriptional analysis of MPM cells cultured in 2D and 3D Nichoids highlights distinct transcriptional signatures on the three-dimensional culture. (A). Distance matrix analysis evidenced the presence of specific clusters among 2D and 3D Nichoids. (B). PCA analysis showed that 3D Nichoids are more similar than 2D Nichoids. (C) Venn diagram of protein coding genes expressed by 4 primary MPM cells grown in 2D Nichoids. Number of common genes in all possible conditions are indicated. Common genes among all the cell lines are bolded in a red box. (D) Venn diagram of protein coding genes expressed by indicated MPM cells cultured in 3D Nichoids. Number of common genes in all possible conditions are indicated. Common genes among all the cells are bolded in a red box. (E) Venn diagram obtained by comparing common genes of all indicated cell lines in C and D. Number of protein coding genes specifically expressed in 3D Nichoids is highlighted in the red box. (F). Volcano plot evidencing significative deregulated genes among 2D and 3D Nichoids, highlighted in green. Criteria for selection are evidenced: green for |log2(FoldChange)| > 1 and adjusted p value ≤ 0.05; orange for log2(FoldChange) <−1 e > 1; red for adjusted p value ≤ 0.05. (G). Heatmap of significative DE genes among 3D Nichoids vs. 2D Nichoids. Each row represents a gene, while columns depict different samples. The color gradient represents gene expression levels, with red indicating upregulated genes and blue representing downregulated genes in 3D Nichoids compared to 2D Nichoids. Higher color intensity reflects higher expression levels. The analysis highlights distinct transcriptional signatures providing insights into gene expression alterations in response to three-dimensional culture conditions. All analyses were performed in biological replicates using four distinct samples.

