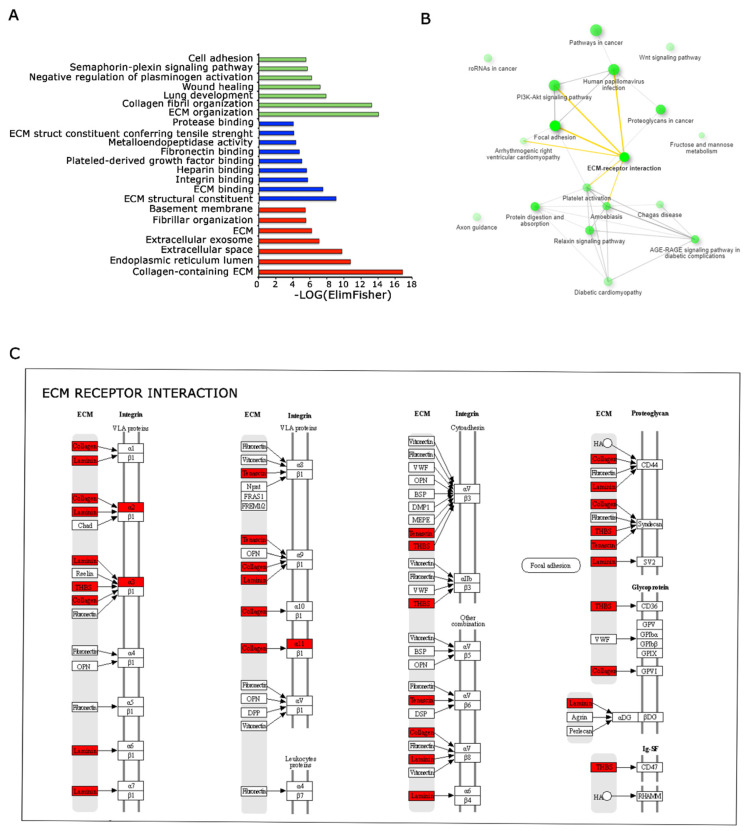
Figure 6.
Functional analysis of DE genes among 3D and 2D Nichoids depict the perturbation of the ECM pathway. (A). Representation of enriched biological processes (represented in green), molecular functions (represented in blue) and cellular components (represented in red)identified through Gene Ontology analysis. Significantly enriched terms are highlighted, indicating biological pathways implicated in the studied conditions. (B). Pathway relationships depicted based on gene enrichment analysis. Interconnected pathways share common genes, emphasizing the interplay and connectivity among molecular pathways influencing cellular responses in the investigated system. ECM interaction is evidenced in bold and links in yellow. (C). Pathview representation displaying the ECM interactions enriched with deregulated genes between 3D and 2D Nichoids. Genes highlighted in red represent the upregulated genes in our dataset, emphasizing their involvement in the ECM pathways and cellular interactions.

