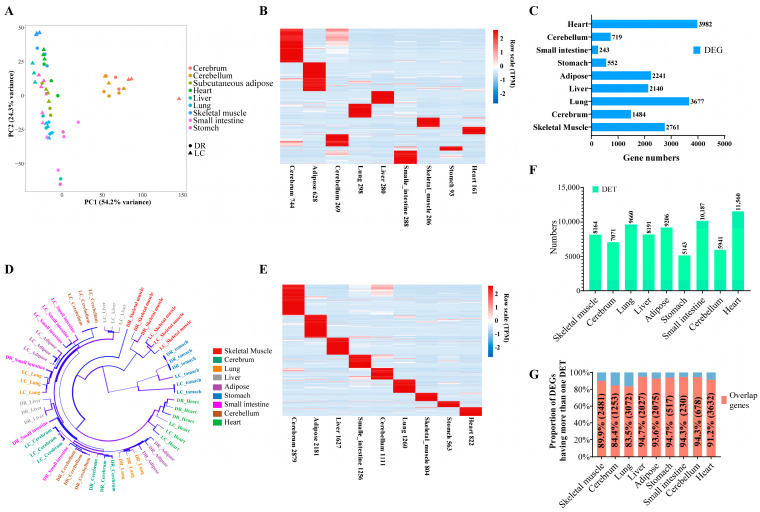
Figure 1.
The expression characteristics of genes and transcripts in different tissues and breeds. (A) Principal coordinate analysis of nine tissues in DR and LC pigs. Colors: different tissues. Shape: different breeds. (B) Heatmap of tissue-specific genes among different tissues. (C) The DEGs in nine tissues between DR and LC pigs. (D) Hierarchical clustering tree of nine tissues in DR and LC pigs. Colors: different tissues. (E) Heatmap of tissue-specific expressed transcripts in different tissues. (F) The DETs in nine tissues between DR and LC pigs. (G) The proportion of differentially expressed genes with at least one differentially expressed transcript. DR: Duroc pigs. LC: Luchuan pigs. DEGs: differentially expressed genes. DETs: differentially expressed transcripts.

