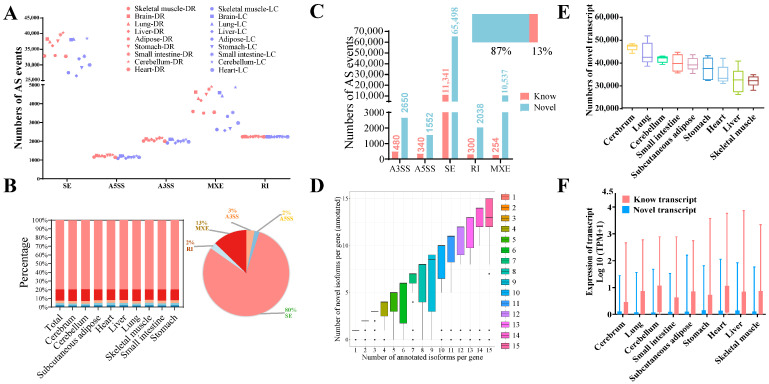
Figure 2.
Analysis of alternative splicing and identification of novel transcripts in nine tissues between two breeds. (A) Number of AS events in each sample from nine tissues in DR and LC pigs. Colors: different tissues. Shape: different breeds. (B) The distribution of five types of AS events in nine tissues. Left: proportion of five AS events in nine tissues. Right: total percentage of five AS events. (C) The number of known and novel AS events. Top right: percentage of novel AS events. (D) The relationship between the number of annotated isoforms and novel isoforms per gene. (E) The distribution of novel transcripts identified in nine different tissues (TPM > 0.1). (F) Expression abundance of novel and known transcripts (log2(TPM + 1) in nine different tissues. AS: alternative splicing. A3SS: alternative 3′ splice sites, A5SS: alternative 5′ splice sites, MXE: mutually exclusive exons, RI: retained intron, SE: skipped exon. TPM: Transcripts Per Million.

