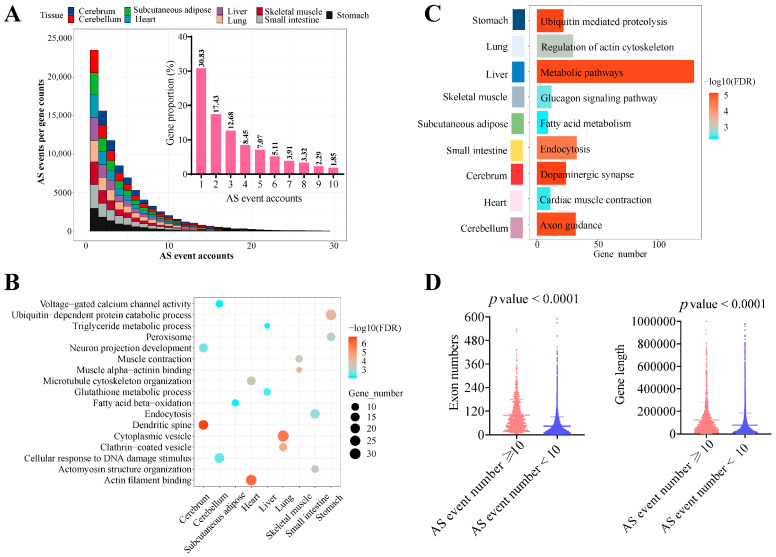
Figure 3.
Molecular characteristics of tissue-specific alternative splicing events. (A) Distribution of AS events produced from genes in different tissues. Colors: different tissues. Top right: proportion of AS events among genes. (B) GO analysis for genes with more than ten AS events. (C) The analysis of KEGG pathways for genes with more than ten AS events. (D) The exon number and sequence length for genes with AS events. GO: Gene Ontology. KEGG: Kyoto Encyclopedia of Genes and Genomes.

