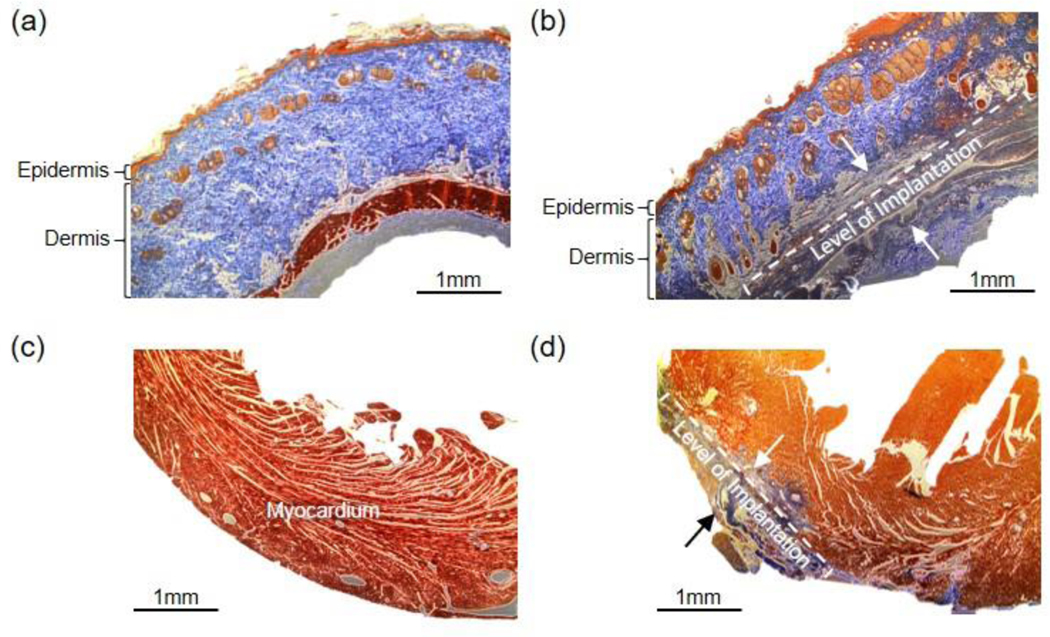
Figure 6.
Histological assessment of device biocompatibility (a-d). (a) Healthy soft tissue. (b) Soft tissue reaction to subcutaneous device implantation. The dotted bracket indicates the stretch of subcutaneous tissue with evidence of remodeling and scar tissue formation. Tissue remodeling is prominent between the two black arrows. The epidermal and dermal tissue do not have signs of remodeling. (c) Healthy myocardium. (d) Myocardium after anterior device implantation. The fibrotic tissue (blue) is seen at the site of device implantation on the surface of the myocardium. The extent of scar tissue fibrosis thickness can be seen between the two black arrows. Scale bar, 1 mm.

