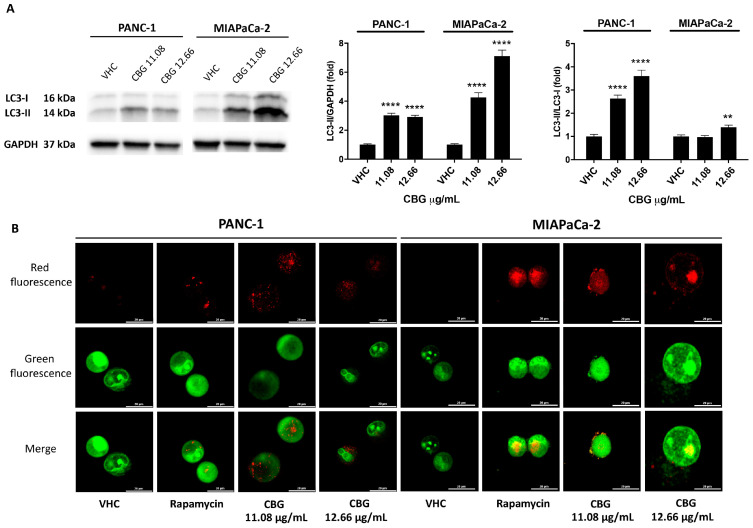
Figure 3.
CBG stimulates autophagy in PDAC cell lines. PDAC cell lines were treated with CBG and analyzed at 48 h post-treatment. (A) The expression of LC3-I and LC3-II was assessed by Western blot. Densitometric values of LC3-II were normalized to GAPDH, which was used as loading control. Densitometric values of LC3-II were also normalized to LC3-I. Images are representative of one of three separate experiments and data are expressed as the mean ± SD of three separate experiments. ** p < 0.01, **** p < 0.0001 CBG- vs. VHC-treated cells. (B) Fluorescent microscope was used to visualize AVOs (red fluorescence) as well as the cytoplasm and nucleus (green fluorescence) after the vital staining of the cells with AO. Representative images of PANC-1 and MIAPaCa-2 cells stained with AO are shown. Rapamycin was used as positive control of autophagic induction.

