Figure 5.
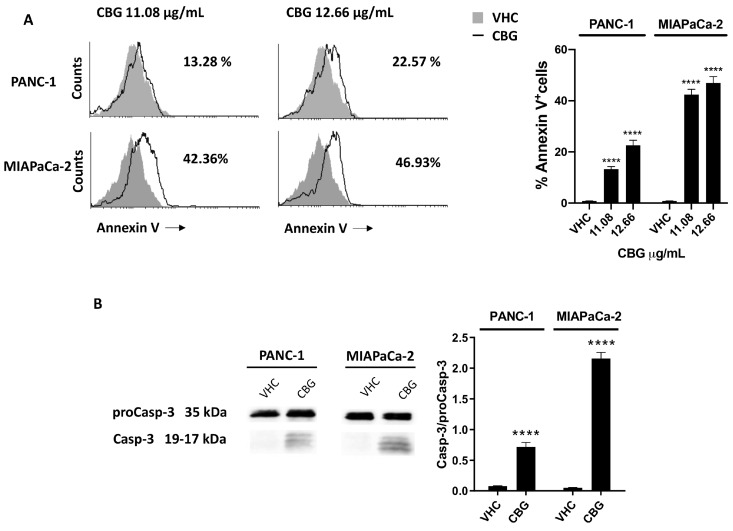
CBG-induced apoptotic cell death in PDAC cell lines. PDAC cell lines were treated with CBG and analyzed at 48 h post-treatment. (A) Flow cytometric analysis was performed after Annexin V staining. Images are representative of one of three separate experiments and histograms are the mean ± SD of three separate experiments. The percentage refers to Annexin V+ cells observed in CBG- vs. VHC-treated cells. (B) The expression of Caspase-3 was determined by Western blot. Caspase-3 densitometric values were normalized to proCaspase-3. Image is representative of one of three separate experiments and bars represent the mean ± SD of three separate experiments. **** p < 0.0001 treated cells vs. VHC.

