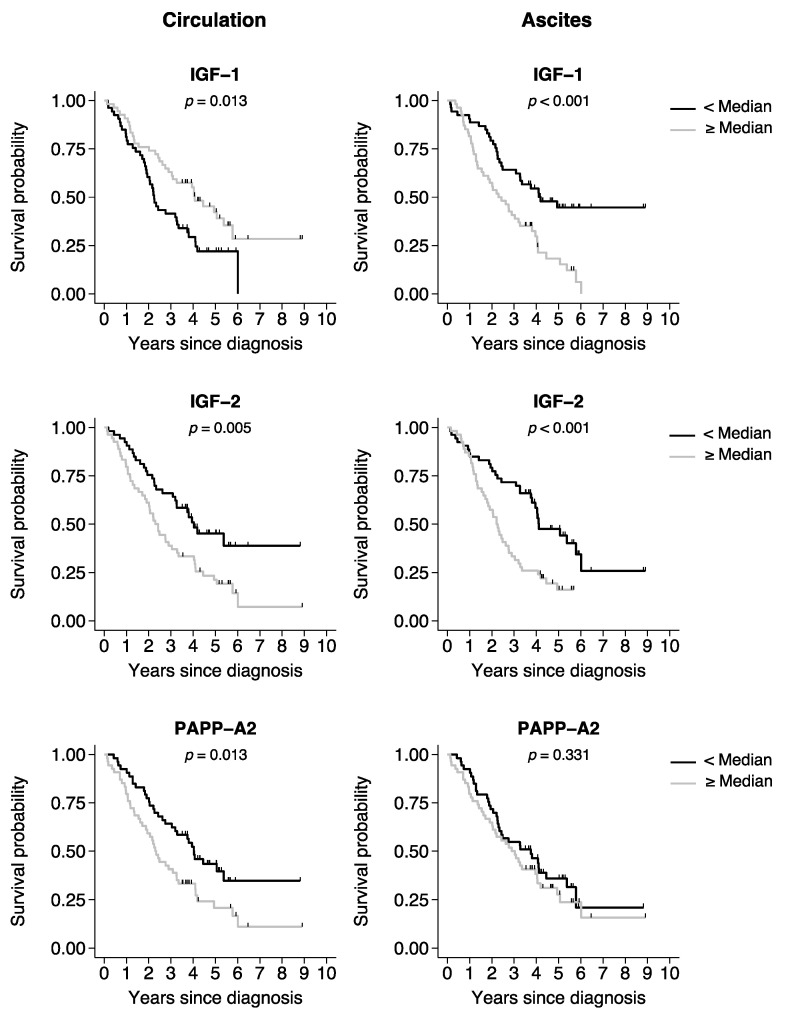
Figure 2.
Kaplan–Meier curves of overall survival in patients with ovarian cancer. Kaplan–Meier survival curves were generated based on the median split of the protein levels in the circulation or ascites. Black line curves represent the group of patients with a protein level below the median. Gray line curves represent the patients with a protein level above the median. p-values: log-rank test for survival equality in the two groups. Tick marks represent censored events. IGF, insulin-like growth factor; PAPP-A2, pregnancy-associated plasma protein-A2.

