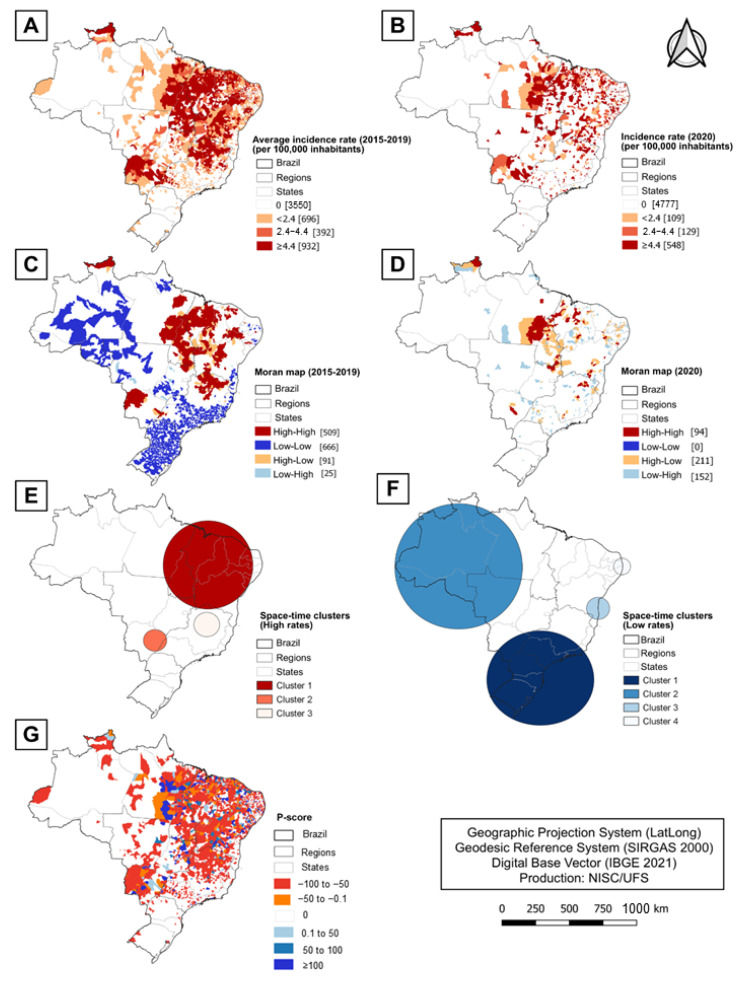
Figure 5.
Spatial and spatiotemporal analysis of VL incidence in Brazil, 2015–2020. (A) Average crude incidence rate of VL (2015–2019); (B) crude incidence rate of VL (2020); (C) univariate LISA analysis of average crude incidence rate of VL (2015–2019); (D) univariate LISA analysis of crude incidence rate of VL (2020); (E) space–time scan analysis of monthly crude incidence rate of VL in 2020 (high rates); (F) space–time scan analysis of monthly crude incidence rate of VL in 2020 (low rates); (G) spatial distribution of P-score at the municipal level.

