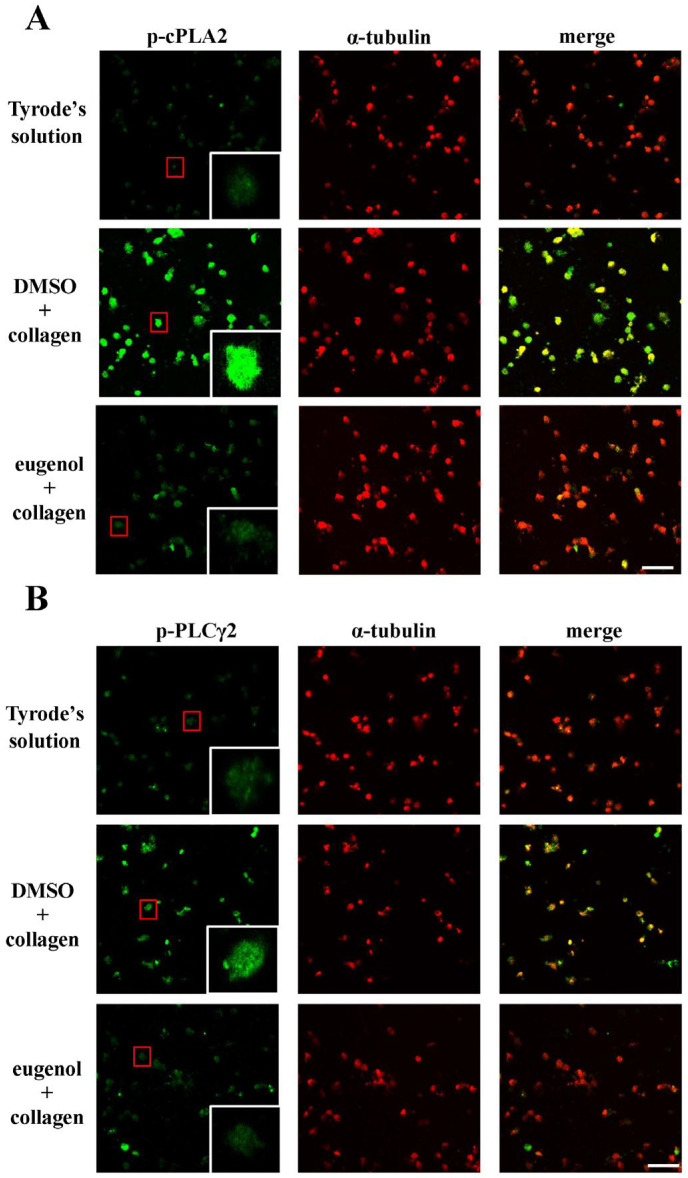
Figure 4.
Eugenol’s inhibitory effects on the activation of cytosolic phospholipase A2 (cPLA2) and phospholipase Cγ2 (PLCγ2) were visualized using confocal laser microscopy. Washed platelets were pre-incubated with either 0.1% DMSO or eugenol (4 µM) and subsequently exposed to collagen (1 μg/mL) for confocal microscopic evaluation at 1000× magnification. This assessment specifically focused on the visualization of phosphorylated (A) cPLA2 and (B) PLCγ2, represented by green fluorescence, along with α-tubulin indicated by red fluorescence. The presented images are representative of four independent experiments. The red boxes serve to highlight one of the numerous cells that have been phosphorylated and are further magnified within white boxes. The scale bar is 10 μm.

