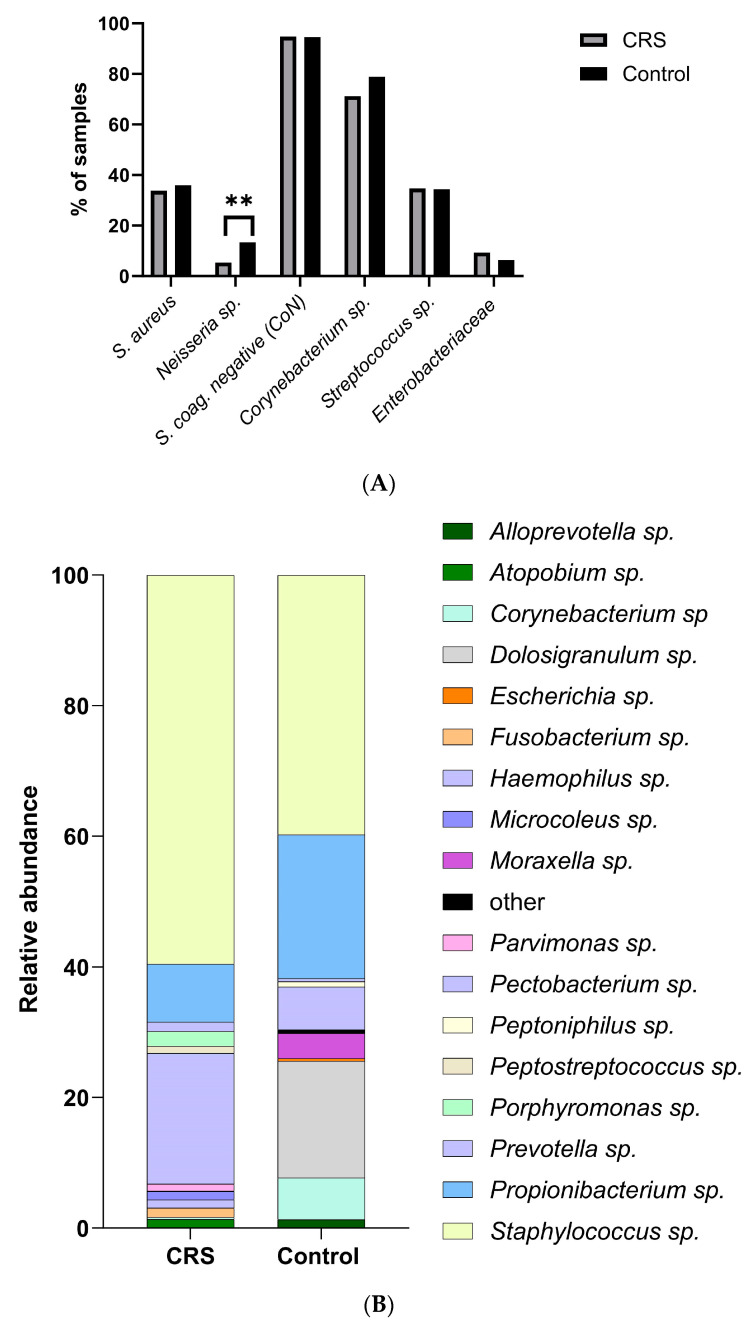
Figure 1.
Distribution of the bacterial community in control and CRS samples. (A) Bacterial community composition at the species level of the nasal cavities of control and CRS patients was analysed by conventional culture-dependent techniques. Differences in the proportions between both groups were compared using Fisher’s exact test (** p < 0.01). (B) Sinonasal microbial composition of control and CRS samples was analysed by metagenomics. The composition of the bacterial community at the genus level is shown.

