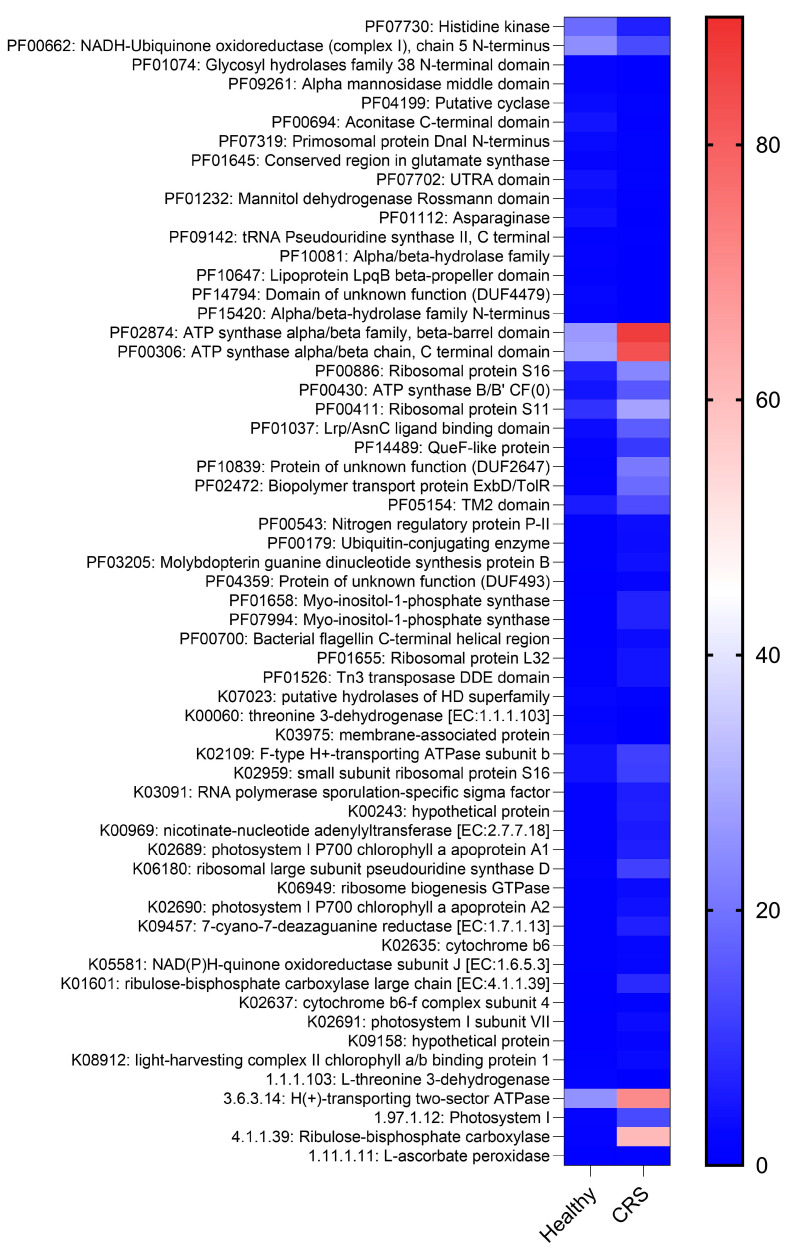
Figure 2.
Metabolic profiles from control and CRS samples. The heatmap depicts metagenomic bacterial community functional annotation based on PFAM, KEGG orthologs and enzyme commission (EC) abundance for both groups. The heatmap’s colour gradient is based on the pathway enrichment in each group (high enrichment in red to low enrichment in blue) and the unit is transcripts per million (TPM).

