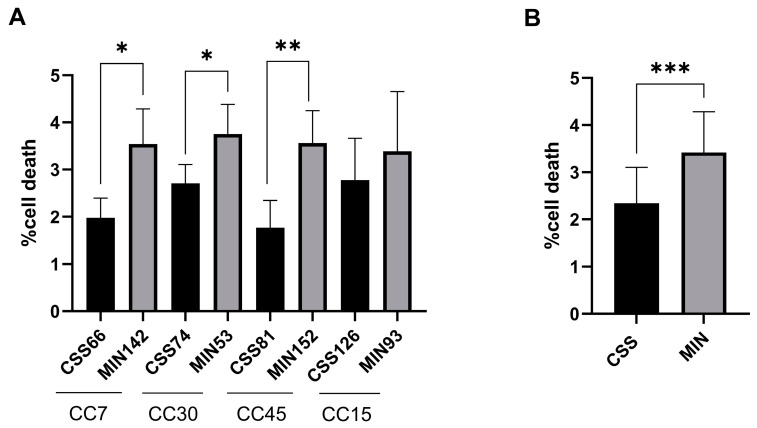
Figure 3.
Cell death induction by S. aureus isolates from control (MIN) and CRS (CSS) donors. (A) Staphylococcal isolates from control and CRS donors from the main clonal complexes (CC7, CC30, CC45 and CC15) were selected. Human epithelial lung A549 cells (ATCC: CCL-185) were infected, and cell death induction was measured by staining the cells with propidium iodide after 24 h. (B) Proportions of dead cells obtained for staphylococcal isolates from the control and CRS groups. Differences between the proportions of dead cells infected with isolates from both groups were analysed by unpaired t tests (* p < 0.05, ** p < 0.01 and *** p < 0.001). Data are presented as the average of triplicate determinations, and error bars represent the standard deviation.

