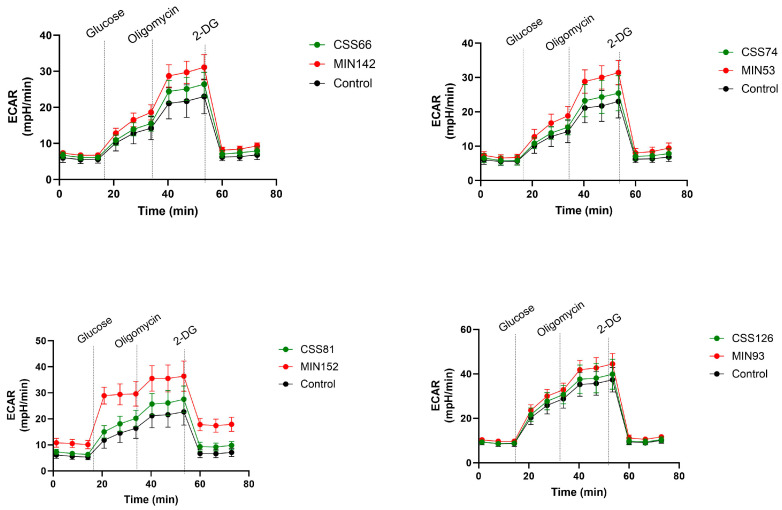
Figure 5.
S. aureus isolates from the control and CRS groups induced glycolysis in different manners in A549 cells. Metabolic activity of A549 cells was monitored by measuring the extracellular acidification rate (ECAR) of uninfected and infected cells by Seahorse. A549 cells were infected with four different control and CRS S. aureus strains. The additions of glucose, oligomycin and 2-DG (deoxyglucosoe) are indicated. Statistical significance in the assay was compared to PBS alone and between the strains by two-way ANOVA (Table S4A,B).

