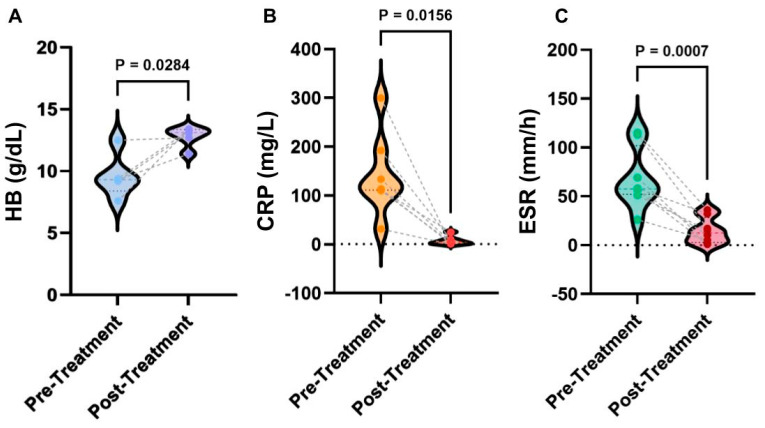
Figure 2.
Statistical analyses of laboratory results of anakinra therapy. (A) Comparison of HB levels pre- and post-treatment. (B) Comparison of CRP levels pre- and post-treatment. (C) Comparison of ESR pre- and post-treatment. p values were determined from the Wilcoxon rank-sum test. The dataset for all laboratory data is reported in Supplemental Materials.

