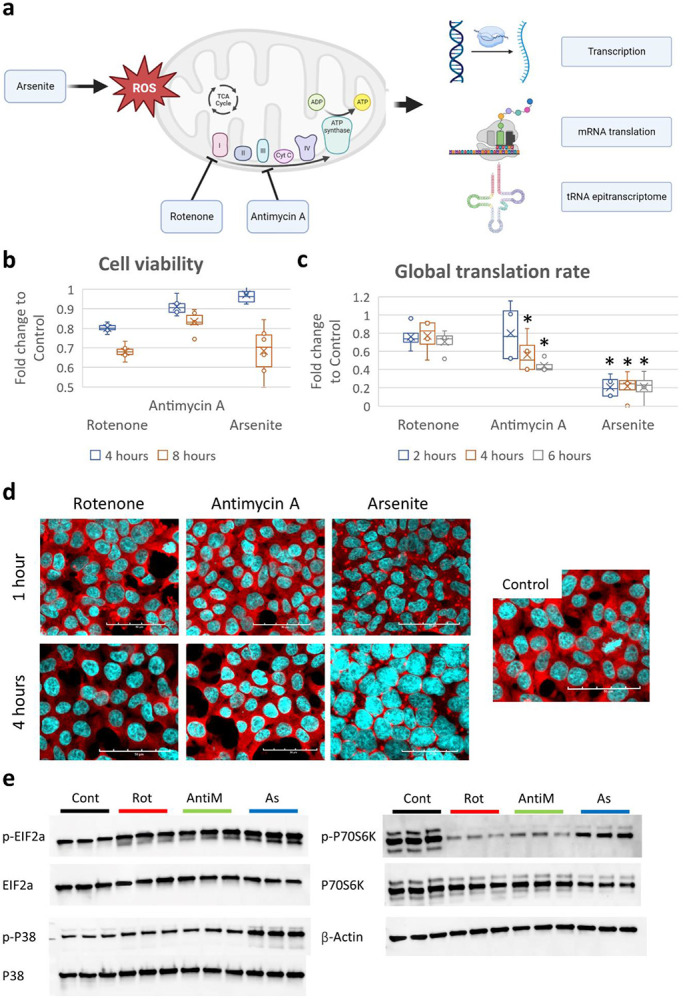
Figure 1: Induction of mitochondrial stress.

a: Schematic of the study analysis. b: Cell viability analysis via MTT assay after exposure to 10μM Rotenone (Rot), 10μg/ml Antimycin A (AntiM), or 100μM sodium metaArsenite (As). c: Puromycin incorporation assay after stress exposure. d: Staining with anti-G3BP1 (in red) for analysis of stress granules (SG) assembly after stress. e: Western blot analysis of ISR and RSR markers after 8 hours of stress.
