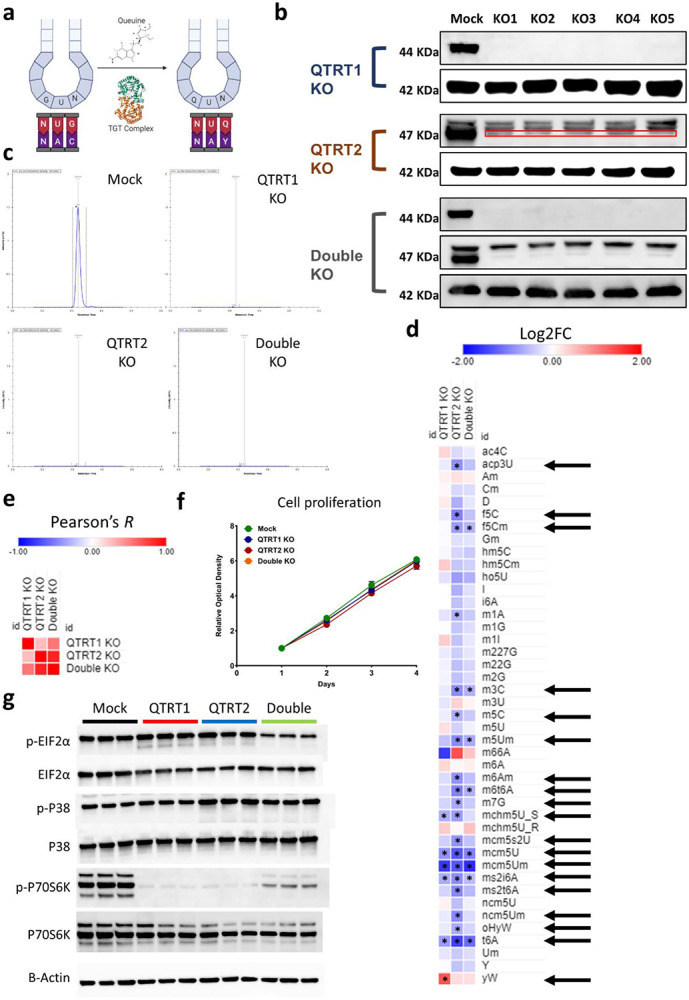
Figure 5: tRNA-Q loss induces translational stress.

a: Schematic of tRNA-Q mediated codon recognition. b: Validation of QTRT1, QTRT2, and double KO using western blots. c: Validation of tRNA-Q peak loss using LC-MS/MS. d: Analysis of the impact of tRNA-Q loss on other RNA modifications in the three KO cell lines. Arrows: significant on ANOVA analysis. Asterisk: fold change > 1.5, p < 0.05. Data normalized to Mock. e: Pearson’s correlation analysis using data from d. f: Proliferation rates of the three KO cell lines. g: Analysis of markers of ISR and RSR using western blotting.
