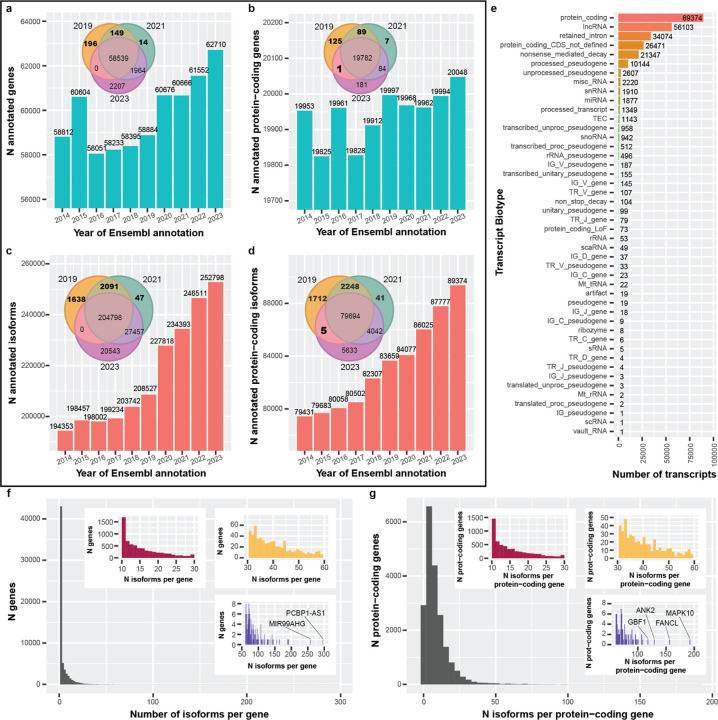
Figure 2: Ensembl gene and isoform annotations generally increased between 2014 & 2023, and reveal complex RNA isoform diversity.
For figures (a-d), a representative Ensembl annotation was chosen for each year from 2014–2023. (a) The number of annotated genes per year from 2014–2023. After 2016, the overall trend is an increase, with a reasonably sharp increase around 2020. We see that some annotations appear to be dropped completely between years (Venn diagram). (b) Same as (a) but restricted to protein-coding genes. In contrast, there were more fluctuations in the number of annotated protein-coding genes, though still a positive trend. One gene was annotated as protein-coding in the 2019 and 2023 annotations but was not in 2021. (c) Looking specifically at RNA isoform annotations, the trend is positive, with a sharp increase in 2020. (d) Similar patterns exist for RNA isoforms annotated as protein-coding. There are five isoforms that were not labeled as protein-coding in 2021 but were in 2019 and 2023. (e) Bar plot showing transcript biotype for all isoforms in 2023. As expected, protein-coding was the most common biotype. Interestingly, retained intron was 3rd and nonsense mediated decay was 5th. (f) Histogram showing number of annotated isoforms per gene. Colored, zoomed subplots shown for convenience. The majority of gene bodies had only one annotated isoform (median = 1; 75th percentile: 4; 85th: 8; 95th: 16), but some had more than 100. The most annotated isoforms for a single gene body was 296 (PCBP1-AS1; ENSG00000179818). (g) Similar to (f) but showing the number of isoforms per protein-coding gene. The median number of annotated isoforms is 6 (75th percentile: 11 isoforms). The most annotations for a single protein-coding gene body was 192 (MAPK10; ENSG00000109339).

