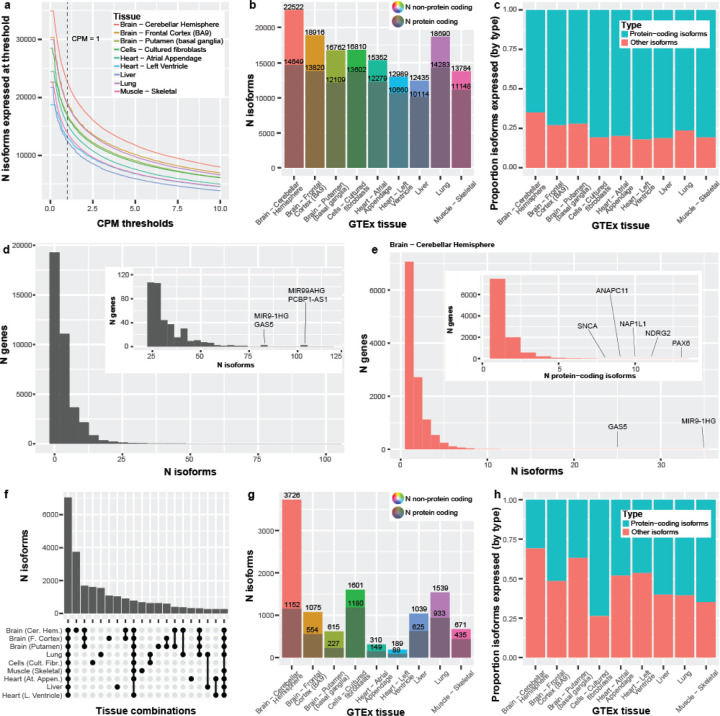
Figure 3: Long-read RNA isoform expression reveals high isoform diversity and variation across nine tissues.
(a) Line graph showing the number of isoforms expressed across counts-per-million (CPM) thresholds from 0–10. Vertical line represents CPM = 1, where our threshold looks at everything with a CPM >1. The initial flat portion of each distribution is due to filtering out isoforms that did not have a median-unique-counts ≥ 1. (b) Number of isoforms and protein-coding isoforms (the darker shaded) expressed at our standard thresholds of median-unique-counts ≥ 1 and CPM > 1. The total number of expressed isoforms differs between tissues. (c) Bar plot comparing the proportion of protein-coding isoforms to other isoforms expressed across the nine GTEx tissues. Cerebellar hemisphere expressed the highest number of non-protein-coding RNA isoforms (7,873; 35.0%). Comparatively, the left ventricle of the heart expressed the smallest ratio of non-protein-coding isoforms (17.9%; 2,329 isoforms; Chi-square p = 1.90e-255). (d) The number of distinct isoforms expressed per gene, using a minimum threshold of one unique count in any sample for any tissue (maximum sensitivity). Zoomed subplot shown for conviencence. PCBP1-AS1 expressed the most isoforms (105) for a single gene body and FANCL expressed the most (60) for a single protein-coding gene. 88.1% of gene bodies expressing ≥ 10 distinct RNA isoforms were protein coding, and 1,085 were medically relevant genes, as defined by Wagner et al.20, including PSEN2 (19 isoforms), PAX6 (43), and MAPK10 (46). Only ten gene bodies expressed ≥ 60 distinct RNA isoforms. (e) The number of isoforms per gene or number of protein-coding isoforms per gene (nested plot) expressed in cerebellar hemisphere using our standard threshold (median unique count ≥ 1 & CPM > 1). We saw 25 genes expressing ≥ 10 isoforms and 123 genes expressing ≥ 5 protein-coding isoforms. (f) Upset plot showing the first 20 interactions of isoform overlap between tissues. Exactly 7,023 isoforms had shared expression across all nine tissues. Cerebellar hemisphere has the largest number of isoforms uniquely expressed in a single tissue—more than half (53.1%) of the number of isoforms expressed across all nine tissues. (g) Bar plot showing the total number of isoforms that were uniquely expressed in each tissue. The grayed portion is the number of unique isoforms labeled protein-coding. (h) Bar plot comparing the proportion of protein-coding to non-protein-coding RNA isoforms, uniquely expressed by tissue. The cerebellar hemisphere expressed 3,726 isoforms uniquely, where only 30.9% (1,152) were protein-coding. Exactly 64.8% (435 out of 671) were protein-coding for skeletal muscle, however.

