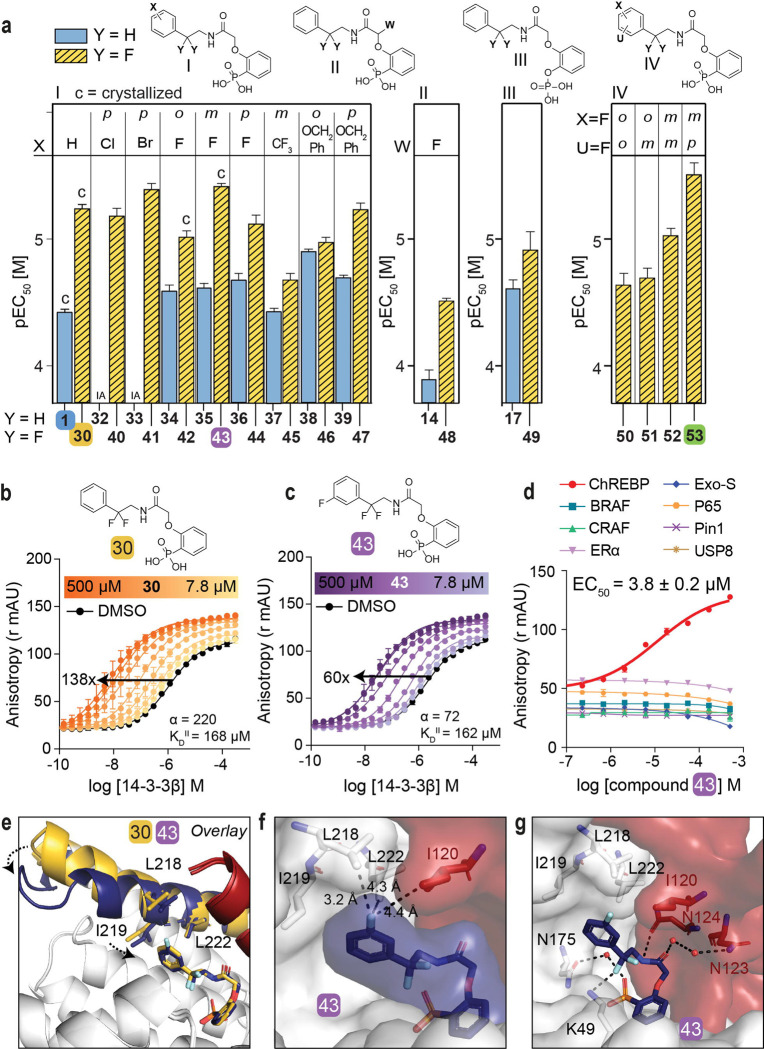
Fig. 3: Fluorination of compounds enhances stabilizing potency.
a. Structures and bar graphs of pEC50 values derived from FA compound titrations, for Y=H (blue bars) and Y=F (yellow bars). (For graphs see Fig. S4, S5, for EC50 values see Table S2) (mean ± SD, n=2). b, c. Titration of 14-3-3β to FITC-labeled ChREBPα peptide (10 nM) against varying fixed concentrations of 30 or 43 (0–500 μM) (mean ± SD, n = 2), including the cooperativity factor (α and intrinsic affinity of the stabilizers to 14-3-3 (KDII). d. Selectivity studies by titrating 43 to 14-3-3β and eight different 14-3-3 interaction FITC-labeled peptides (all 10 nM) (mean ± SD, n = 2). e. Crystallographic overlay 30 (yellow) and 43 (purple) in complex with 14-3-3σ (white cartoon) and ChREBPα (red cartoon). Helix 9 of 14-3-3σ is colored in the same color as the corresponding compound, showing a helical ‘clamping’ effect when 43 (purple) is present. f. Surface representation of 43 (purple) in complex with 14-3-3σ (white) and ChREBPα (red), showing the distances (black dashes) of the 43 m-F substitution to the residues (sticks) of 14-3-3σ and ChREBPα. g. Interactions of 43 (purple) with 14-3-3σ (white) and ChREBPα (red) (relevant side chains are displayed in stick representation, polar contacts are shown as black dashed lines).

