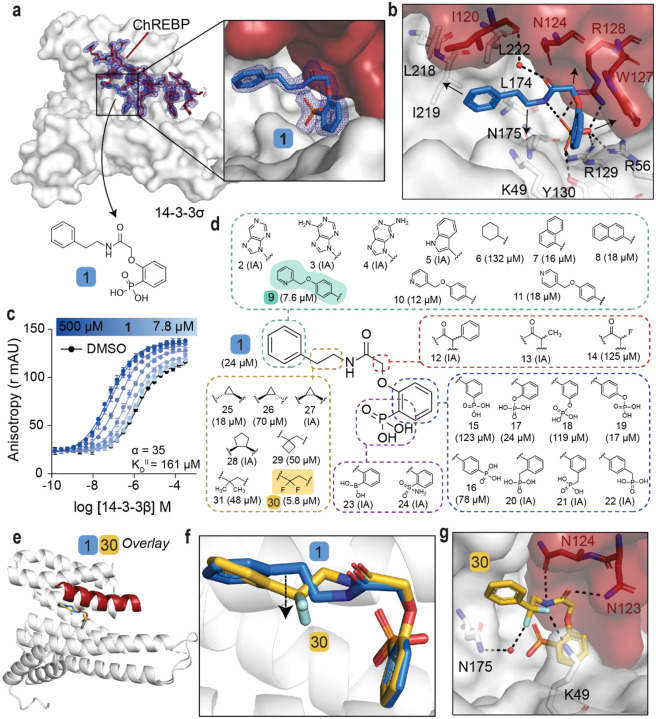
Fig. 2: SAR around analog 1 results in improved stabilizer 30.
a. Crystal structure of compound 1 (blue sticks) in complex with 14-3-3σ (white surface) and ChREBPα (red sticks and surface). Final 2Fo-Fc electron density contoured at 1.0σ. b. Interactions of 1 (blue sticks) with 14-3-3σ (white) and ChREBPα (red) residues (relevant side chains are displayed in stick representation, polar contacts are shown as black dashed lines). c. FA 2D protein titration of 14-3-3β in FITC-labeled ChREBPα peptide (10 nM) and varied but fixed concentrations of 1 (0–500 μM), including the cooperativity factor (α, determined, by fitting, using a thermodynamic equilibrium model32) and intrinsic affinity of 1 to 14-3-3 (KDII). d. Structure and activity analogs of 1. The two best compounds are marked in cyan and yellow. EC50 in parenthesis with mean ± SD, n = 2. For FA titration graphs see Fig. S4, S5. e, f. Crystallographic overlay of 1 (blue sticks) with 30 (yellow sticks) in complex of 14-3-3σ (white cartoon) and ChREBPα (red cartoon). g. Interactions of 30 (yellow) with 14-3-3 σ (white) and ChREBPα (red) (relevant side chains are displayed in stick representation, polar contacts are shown as black dashed lines).

